Ready to transform data to insight?
Getting started with ScaleXP is easy! Try it for yourself with a 7 day free trial and get set up in minutes. Or, if you’d like to take a deeper dive, book a demo at a time that suits you.

Net Dollar Retention is used to measure growth in revenue from existing customers. It can also be called Net Revenue Retention. Common abbreviations are NDR or NRR.
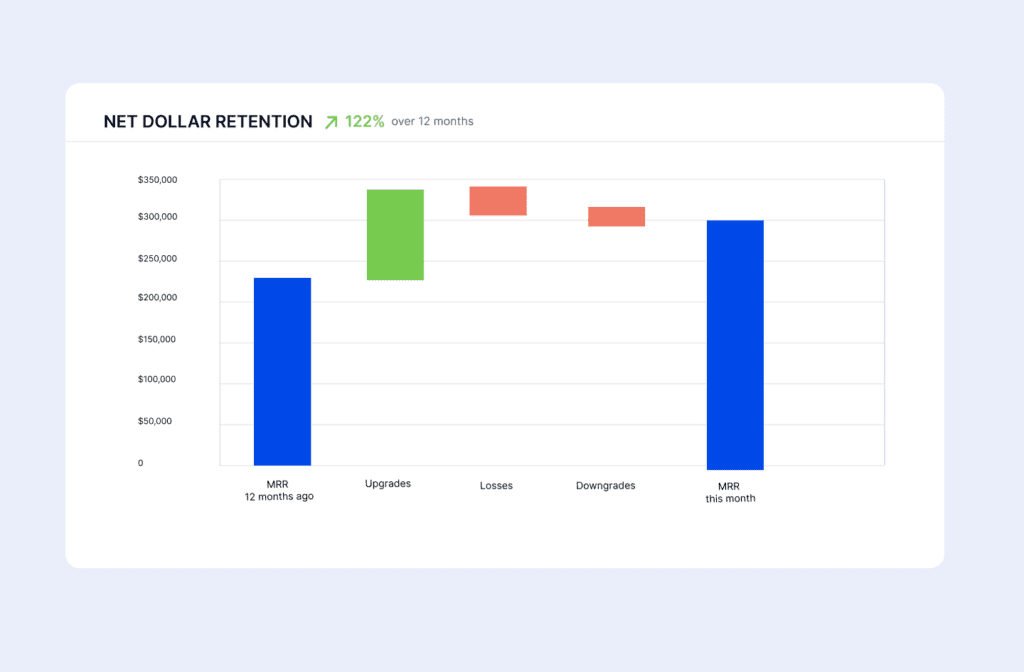
To calculate Net Dollar Retention, split revenue or MRR into upsells, downgrades, and losses.
Net Dollar Retention is usually expressed as an annual percent, using total upsells, downgrades, and lost contracts across a year.
Using this information, the formula for Net Dollar Retention is:

If the data on upsells, losses and downgrades is too complex or tedious to calculate, you can look at the revenue in total as long as you isolate revenue or MRR from current customers (excluding MRR from those recently acquired).
As an example, let’s say that a software company has a group of 100 customers who generated a total of $10,000 in revenue in Q1 2022. In the previous period, Q4 2021, these same customers generated a total of $9,000 in revenue. The NDR for this group of customers would be calculated as follows:
Net Dollar Retention = ($10,000 / $9,000) x 100% = 111.1%
In this example, the NDR is 111.1%, indicating that the business was able to retain and grow its revenue from these customers by 11.1% over the previous period.
To use the most recent change in monthly values to calculate the annua rate, take the monthly net dollar retention value to the power of twelve. This is shown in the formula below.

Gross Dollar Retention excludes the impact of Upsells or Expansions. It assesses only the impact of churn or downgrade.
Net Dollar Retention is an important metric for subscription-based businesses because it provides insights into how well the business is retaining and growing revenue from current customers. It is widely benchmarked and frequently used in valuations.
NDR can vary widely depending on the nature of the business and the specific group of customers being analysed. In the first instance, it’s important to compare NDR internally, assessing trends over the last several months or quarters.
NDR should increase over time, ideally moving above 100% on an annual basis. A low or falling NDR can indicate that the business is losing customers or failing to upsell and cross-sell to its existing customers.
The ability to increase NDR is correlated to the size of your customers. Data indicates that it is harder to drive NDR increases with smaller companies and consumers than corporations.
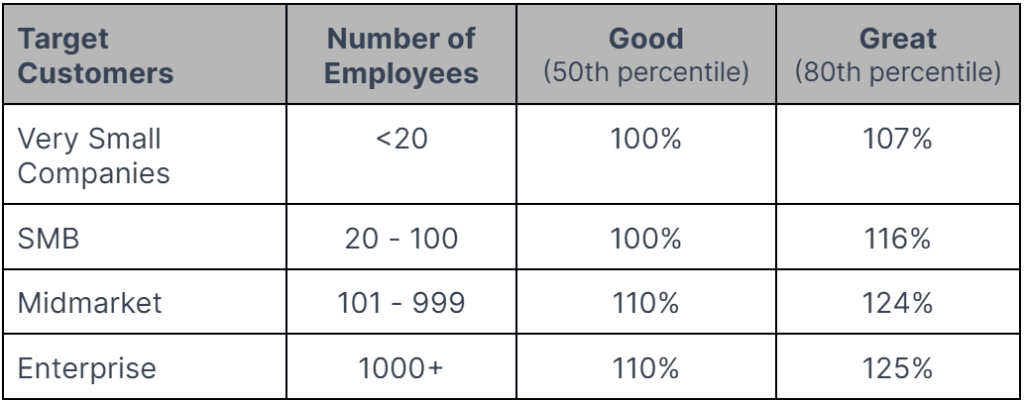
This is reflected in the data below, which shows Net Dollar Retention benchmarks for 2022. The data is compiled by OpenView VC and includes over 600 SaaS companies globally.
To read the table, identify the row of data that best represents your customer size. The third column provides an average annual NDR (50th percentile) while the last column is a great result (80% percentile).


ScaleXP fully automates Net Dollar Retention. Through a series of smart algorithms, the system will classify your revenue into New, Lost, Upsells and Downgrades. These algorithms make it easy to fully automate both revenue recognition and critical SaaS metrics. Click here to learn more.

Percentage increase in MRR over a certain period of time, most typically a quarter or a year.

Measures the growth and profitability of a subscription business. Calculated as annual revenue growth rate plus EBITDA margin.
Getting started with ScaleXP is easy! Try it for yourself with a 7 day free trial and get set up in minutes. Or, if you’d like to take a deeper dive, book a demo at a time that suits you.
© 2024 ScaleXP | All Rights Reserved Company Number: 11447363
