See how ScaleXP works with Xero, QuickBooks or Zoho Books.
In a 30-minute demo, we’ll show the relevant workflows using example data and discuss how they could apply to your finance process. Complex requirements? Discuss them with us first.
Understand customer churn, calculate it with your own numbers, see what the published retention benchmarks show, and get practical tips to reduce it.

CUSTOMER CHURN
No benchmark for logo churn is published.
The surveys report retention in dollars, not logos. Figures circulating as average SaaS churn blend B2C and self-serve with B2B.
2026 benchmark · 226 of 342 B2B SaaS companies
This article will provide
Customer churn rate is the percentage of customers who stop doing business with a company over a given period. It is also called logo churn, customer turnover or customer attrition.
Churn is one of the clearest signals of whether customers find lasting value in a product. A rising churn rate usually points to a problem with fit, onboarding or service.
In a SaaS business, SaaS churn is usually tracked as a monthly churn rate alongside revenue churn, because a shrinking customer base compounds quickly. When customers cancel faster than they are replaced, long term growth stalls even while new sales look healthy, which is why reducing churn is normally a customer success problem before it is a pricing one.
The customer churn rate is the number of lost customers divided by the total number of customers at the beginning of the period, and then multiplied by 100 to express the result as a percentage.
For example, if a company had 100 customers at the beginning of the year, and 10 of those customers stopped doing business with the company during the year, the customer churn rate would be 10/100 * 100 = 10%.
Comparisons of customer churn rate are annual. If churn is calculated for a period of less than one year, it is generally annualized to express the rate as an annual one.
To annualize the rate, it is most accurate to convert the churn into a retention rate, then calculate to the power of the number of periods.
So for example, if 10% was the churn in a quarter, then the retention rate would be 90% per quarter, or 0.9 to the power of 4 = 0.656 per year. This is 66% retention per year meaning an annual churn rate of 34%.
Definitions, formulas, and this year’s median and top-quartile numbers for all 20 metrics in the library. One PDF you can take straight into your next board meeting.
See our privacy policy.
Your report is ready.
Download the 2026 SaaS Benchmark Report We’ve emailed you a copy as well.A churned customer is a customer who has stopped doing business with a company. This can occur for a variety of reasons, such as dissatisfaction with the product or service, a change in circumstances, or the availability of a better alternative.
The measure of a churned customer is business specific. Some companies consider a customer churned when they end a subscription. Others may wait several months before classifying a customer as churned.
Customer churn is typically used to measure the stickiness of a product or service and to identify areas for improvement. A high churn rate can indicate that customers are not finding value in the product, or that they are experiencing problems with it, while a low churn rate can indicate that customers are happy with the product and are likely to continue using it.
There is no single good or bad customer churn rate. It varies widely by industry, price point and customer type.
A low churn rate is always favorable. What matters most is measuring churn consistently, then checking that the rate is stable or falling.
Customer churn is genuinely harder to benchmark than revenue metrics, because what counts as a lost customer varies between companies. The way round that is to compare within a contract-value band rather than against a single market average — and on that basis there is now solid 2026 data.
Compounded annual logo churn, by average contract value.
| Average contract value | Monthly logo churn | Annual, compounded | Monthly revenue churn |
|---|---|---|---|
| Under $10k (SMB) | 4.2% | 40.3% | 3.8% |
| $10k–$50k (mid-market) | 2.1% | 22.5% | 1.7% |
| $50k–$100k (upper mid-market) | 1.3% | 14.5% | 0.9% |
| Over $100k (enterprise) | 0.7% | 8.1% | 0.4% |
A 4.2% monthly churn rate sounds survivable. Compounded across twelve months it removes 40.3% of the customer base. Reporting churn monthly and reasoning about it annually is one of the most common ways a board pack understates a retention problem.
Note also that revenue churn runs below logo churn in every band — 3.8% against 4.2% at the low end, 0.4% against 0.7% at the top. The customers leaving are smaller than average. That is usually a healthy sign, and it is invisible if you track only one of the two.
Source: Optifai’s 2026 B2B SaaS churn study, covering 939 companies segmented by average contract value. Cross-check figures from CRV’s 2026 SaaS churn benchmarks. Annual figures are monthly rates compounded over twelve months. Logo churn counts customers; revenue churn counts revenue, and the two are reported separately throughout.
See churn compound
ScaleXP tracks which customers leave, when they leave and what happens to the revenue attached to them. See logo churn alongside retention and revenue churn, without manually matching customer lists.
Apply one churn definition consistently, then compare the result by customer segment and cohort.
Automate Your SaaS MetricsExample connected churn view
Quarterly customer churn
4.0%
Four customers lost from a starting customer base of 100 during the quarter.
Illustrative example figures, not your live data.
Churn rate measurement sounds trivial and rarely is. The same customer base can produce very different numbers depending on three choices.
The denominator. Customers at the start of the period is the usual convention. Including customers won during the period flatters the result.
The period. Monthly and annual churn are not interchangeable. Annualizing monthly churn by multiplying by twelve overstates losses, because the base shrinks each month.
What counts as churned. Downgrades, pauses and failed payments are treated differently by different teams. Churn rate calculations should state the rule and apply it consistently, or trend comparisons mean nothing.
They are two views of the same event. On the same basis they are exact complements: a 4% monthly churn rate is a 96% monthly retention rate, and there is no more information in one than the other.
The confusion starts when they are measured differently, which is common. Churn is usually quoted by logo — customers lost — while retention is often quoted by revenue — dollars kept. Those two do not sum to 100%, and a business can lose a tenth of its customers while keeping almost all of its revenue, if the ones that left were small.
| Customer churn rate | Customer retention rate | |
|---|---|---|
| Measures | Customers who left during the period | Customers still there at the end |
| Better when | Lower | Higher |
| Usual basis | Customer count (logos) | Customer count, sometimes revenue |
| Perfect score | 0% | 100% |
The practical rule: state the basis every time. “96% retention” means nothing on its own. See customer retention rate for the other side of this pair, revenue churn for the dollar-weighted version, and gross and net revenue retention for how the same question is answered at revenue level.
Churn is the direct input to customer lifetime. At 2% monthly churn the average customer lifetime is roughly 50 months; at 5% it falls to 20. That single difference changes what you can afford to spend acquiring a customer, which is why churn belongs in any discussion of unit economics rather than only in support reporting.
It also changes the value of expansion. Cross selling and upgrades into a base that churns slowly will compound. The same cross selling effort into a fast-churning base mostly replaces revenue that is already walking out of the door.
Churn rate and complaint volume are often used as proxy metrics for customer satisfaction, because both are already being measured and neither depends on a survey response. Used carefully they are useful. Used alone they mislead, and in opposite directions.
Churn lags. A customer who decided to leave in February may not cancel until renewal in November. Churn describes a decision taken months earlier, which makes it a poor early warning system.
Complaints under-count. Most dissatisfied customers never raise a ticket; they simply use the product less. A falling complaint count can mean the product improved, or that people stopped expecting a fix.
The stronger approach is to treat churn and complaints as confirming evidence rather than leading indicators, and to pair them with usage data. Declining logins or feature use inside an account predicts churn far earlier than either proxy metric, which leaves time to act.
This chart is an example of customer churn rate, with year over year comparisons, making it much easier to understand trends, improvements, even seasonality.
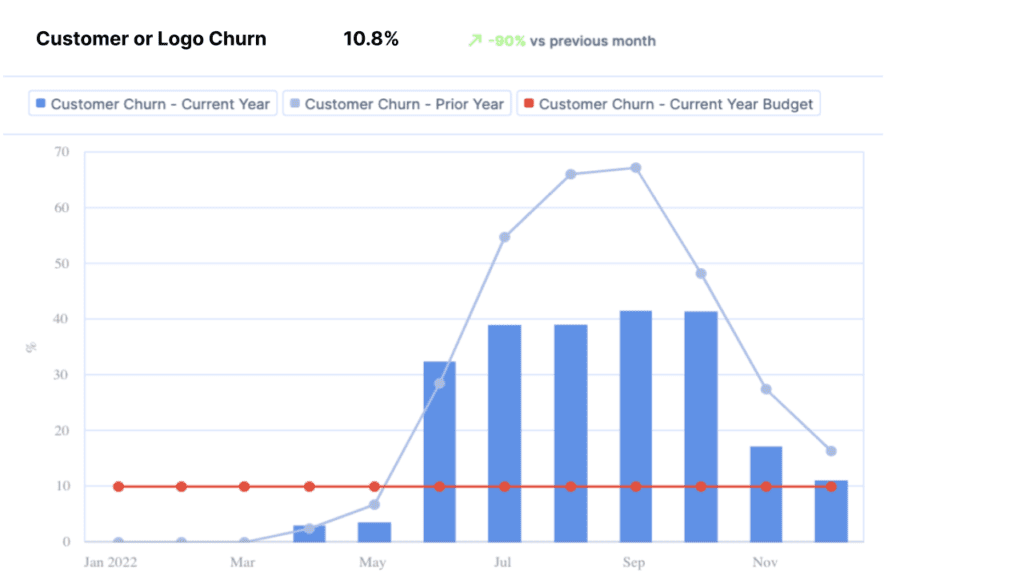
ScaleXP fully automates customer churn. Through integrations with both your accounting and CRM systems, as well as a smart set of text recognition algorithms, the system provides a full suite of SaaS metrics. Customers are automatically tagged as Active, New, Lost, Reactivated using your business definitions.See how ScaleXP automates SaaS metrics.
For an SMB SaaS company with contracts under $10k, a customer churn rate of around 4.2% a month, or 40.3% a year, is the 2026 benchmark. Enterprise SaaS companies with contracts over $100k lose just 0.7% of customers a month, or 8.1% a year, a fivefold difference. Small monthly rates compound into large annual losses, so the annual figure deserves the board’s attention. ScaleXP calculates customer churn automatically from accounting and CRM data, so finance teams see both views and spot rising churn early.
Yes, ScaleXP calculates logo churn automatically by combining invoices from Xero, QuickBooks or Zoho Books with customer records from HubSpot, Salesforce or Pipedrive, tagging every customer as Active, New, Lost or Reactivated under the business’s own definitions. Natalie, Director of Operations, says: “Being able to see which of our customers are churning, identifying who we’ve missed billing that month was invaluable, the missed invoices that show as red / churned probably saved us around £100k!” Finance teams catch churn and billing gaps before they become lost revenue.
ScaleXP keeps customer churn rate consistent with the financials because customer status is driven by actual invoicing in Xero, QuickBooks or Zoho Books, not just a CRM field someone forgot to update. Downgrades, pauses and failed payments are treated the same way every period, under definitions finance controls. Revenue churn and logo churn are calculated from the same data, so the two tell a coherent story. The board receives a customer churn figure that reconciles to the revenue in the management accounts.
Yes, ScaleXP shows customer churn by individual customer, segment and cohort, with year-over-year comparisons in live dashboards and PowerPoint board packs. Finance teams can see which customer groups churn fastest and which cohorts hold up, then drill down in presentation mode to the customers behind each number. ScaleXP also tracks renewals and upsells, so at-risk accounts are visible before they leave. The outcome is churn reporting that explains why customers leave, not just how many, giving leadership time to act.
For Xero, QuickBooks and Zoho Books
ScaleXP connects customer activity with recurring revenue, helping finance identify churn by customer, segment and cohort. See the pattern early enough to act, not after it has disappeared into the total.
From customer movement to a clear churn signal
ScaleXP brings together customers, subscriptions, invoices and relevant CRM information.
Related metricscustomer retention raterevenue churncustomer lifetime valuegross and net revenue retention

Measures growth in revenue from a group of customers. Typically split into upgrades, downgrades, renewals and losses.

Percentage of existing customers who remain customers after a given period.

Percentage of recurring revenue lost due to both cancellation and downgrades.
““producing more insights, faster and with greater accuracy”
SaaS metrics
ScaleXP calculates customer churn and 30+ other SaaS metrics straight from your accounting and CRM data, prepared daily.
In a 30-minute demo, we’ll show the relevant workflows using example data and discuss how they could apply to your finance process. Complex requirements? Discuss them with us first.