SaaS Industry Benchmarks: Growth, CAC, Cash Burn and Valuation
ScaleXP’s six-part SaaS benchmarks series helps finance teams compare their numbers against the wider market. Each report covers one benchmark in detail, using data from UK, US and European SaaS companies.
Between them the reports cover revenue growth, CAC and CAC payback, funding by growth stage, cash burn, R&D spend and ARR valuation multiples. Figures are broken down by funding stage, from Seed through to Series D, so you can compare against companies at your own stage.
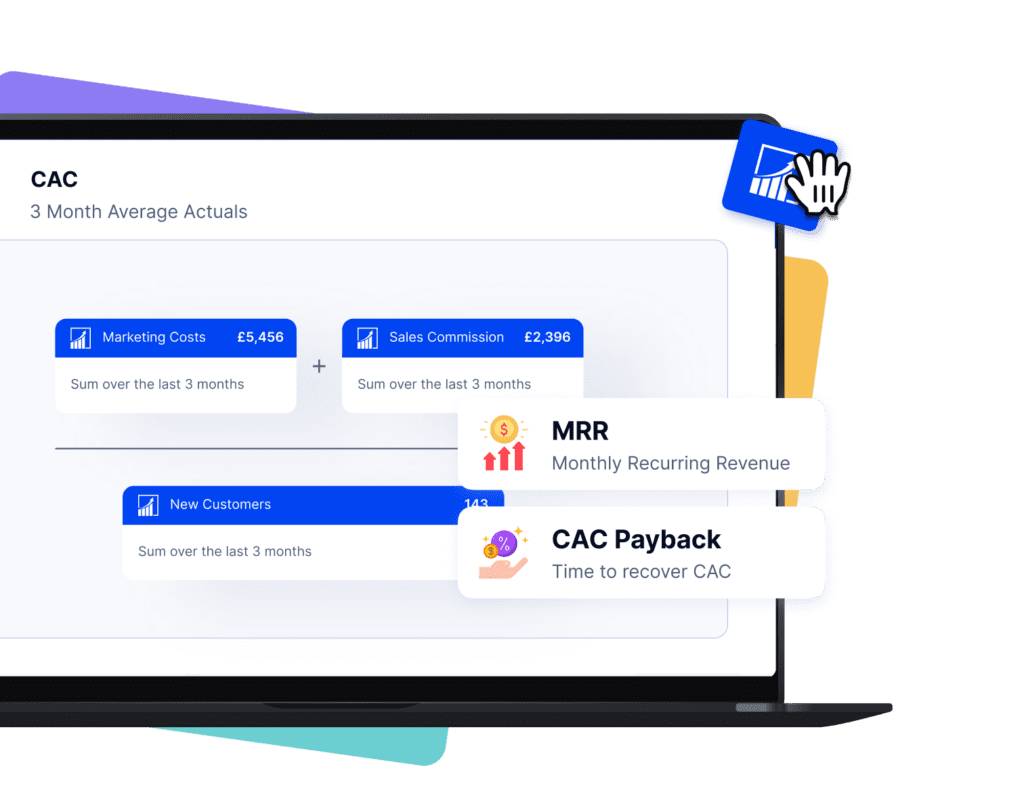
These SaaS industry benchmarks are most useful when measured against your own numbers on the same definitions, because annual contract values, recurring revenue, growth rate, churn rate, retention rate and CAC payback all move together. ScaleXP’s SaaS metrics software calculates them automatically from your accounting and CRM data, so SaaS businesses can benchmark without rebuilding a spreadsheet each month.
Explore the SaaS benchmark reports
How fast should a SaaS company grow? This report benchmarks SaaS revenue growth rates using global data from UK and US sources. Compare your own growth rate against the market.
What does it cost to win a customer, and how long until you earn it back? This report benchmarks customer acquisition cost (CAC) and CAC payback period across SaaS companies.
How much do SaaS companies raise at each stage? This report benchmarks SaaS funding by growth stage, from Seed through to Series D.
How much cash should a SaaS company burn to fund its growth? This report benchmarks cash burn using global data, with insights from the USA and Europe.
How much should a SaaS company spend on R&D? This report benchmarks R&D spend and tech headcount at five growth stages, from Seed to Series D.

What is a SaaS company worth? This report benchmarks ARR valuation multiples, explains how an ARR multiple is calculated, and shows how ARR affects your ability to raise funding.
Which SaaS benchmark should you use?
Start with the management question, then choose the benchmark and comparison group that match it.
| Management question | Benchmark to review | Comparison to match |
|---|---|---|
| Are we growing quickly enough for our size? | Revenue growth rate | ARR or revenue band, company age and funding stage |
| Is customer acquisition efficient? | CAC and CAC payback | Sales model, average contract value and acquisition channel |
| Are we raising an appropriate amount? | Funding by stage | Seed, Series A, Series B, Series C or Series D |
| How much runway are we using to fund growth? | Cash burn and runway | Growth stage, cash balance and current growth rate |
| Is product investment proportionate? | R&D spend | Funding stage, product maturity and team structure |
| How might the market value the business? | ARR valuation multiples | Growth rate, retention, gross margin, profitability and market conditions |
Do not combine figures drawn from different definitions. For example, CAC that excludes sales salaries cannot be compared fairly with CAC that includes the full sales and marketing cost base. Use the detailed reports above to check the source, period and definition before treating any figure as a target.
How to use these SaaS benchmarks
A benchmark describes a distribution, not a target. The median growth rate in any dataset sits in the middle of a wide spread, and half the companies in it fall below that line for reasons that may not apply to you. Treat these reports as context for a conversation, not as a scorecard.
Three things make a comparison meaningful. Match the stage, because a Series A company and a Series C company are not solving the same problem. Match the model, because an annual contract business and a self-serve monthly product produce very different retention rate and churn rate profiles. And match the definitions, which is where most comparisons quietly fail: two SaaS businesses can report gross margin twelve points apart purely because they draw the line between direct and indirect costs differently.
The most useful comparison is usually against your own history. A benchmark tells you where the SaaS industry sits; your own trend tells you whether what you are doing is working.
A few benchmark families behave differently and are worth separating. Growth rate benchmarks vary enormously by revenue band. Retention and churn rate benchmarks depend heavily on the pricing model, since annual contracts suppress visible churn compared with monthly plans. Conversion rate and sales marketing efficiency benchmarks depend on channel mix more than on sector. Customer satisfaction measures are the least comparable of all, because the survey method differs from company to company.
Which benchmarks matter at each stage
Not every metric deserves equal attention at every stage.
Seed to Series A. Growth rate and runway dominate. Investors are underwriting a market and a team, and the question is whether the product is being adopted at all. Cash burn matters mainly as a measure of how much time you have.
Series B. Efficiency starts to count. CAC payback, sales and marketing productivity and net retention become the questions, because the model now needs to show that spending more produces predictable recurring revenue rather than noise.
Series C and beyond. The Rule of 40 and gross margin move to the front, alongside ARR valuation multiples. Growth alone stops being sufficient, and the market prices the combination of growth and profitability.
SaaS benchmarks FAQ
What is a good SaaS growth rate?
It depends heavily on size. Doubling is common below $1m ARR and rare above $50m, so any growth rate should be read against the revenue band it came from. The revenue growth report above shows the current distribution.
What is a good CAC payback period?
Most SaaS businesses aim to recover customer acquisition cost within 12 to 18 months. Shorter payback means growth largely funds itself. Beyond roughly 24 months, growth becomes dependent on outside capital.
What is a good retention rate?
Gross revenue retention above 90% and net revenue retention above 100% are the usual marks for a business selling to other companies. Net retention above 100% means expansion within the existing base outweighs churn, which lets revenue grow even without new logos.
How often should we benchmark?
Once or twice a year is enough for external comparison. Your own metrics deserve a monthly review. The benchmarks themselves move slowly, and reacting to them more often tends to produce churn in strategy rather than progress.