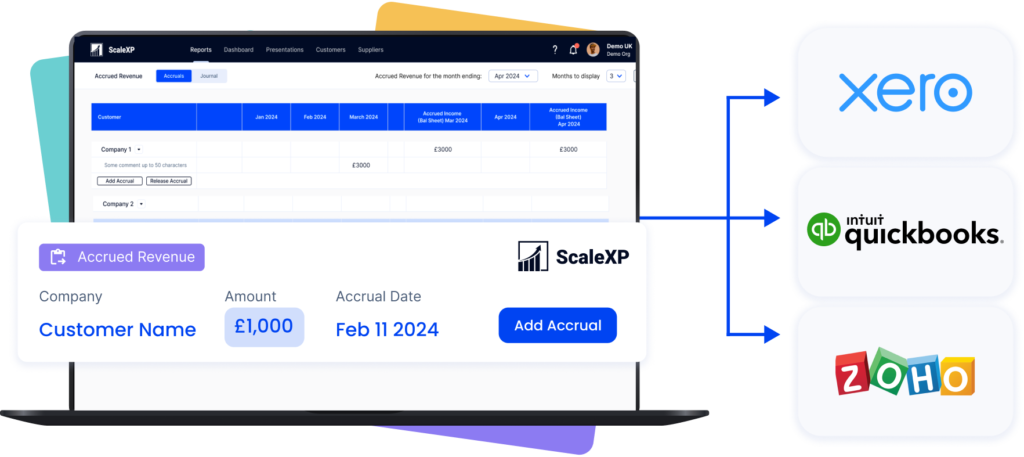
ScaleXP is an approved app for leading accounting & CRM systems
Reporting Should Not Depend on Spreadsheets
Manual reporting slows finance down and weakens control. By the time reports are shared, the numbers often need checking again.
Data sits across accounting, billing, CRM, and spreadsheets
KPI packs take repeated manual updates
Version control creates confusion before leadership meetings
Reports are often outdated when stakeholders review them
ScaleXP Smart Reporting Software
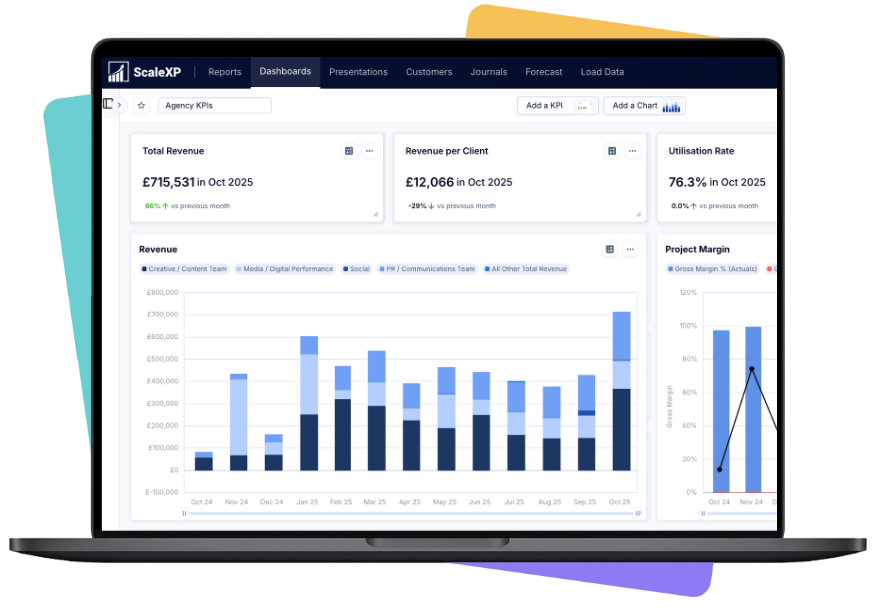
ScaleXP connects accounting, billing, and CRM data in one live reporting layer. Reports update automatically from source systems, giving finance teams real-time numbers, less manual work, and stronger control.
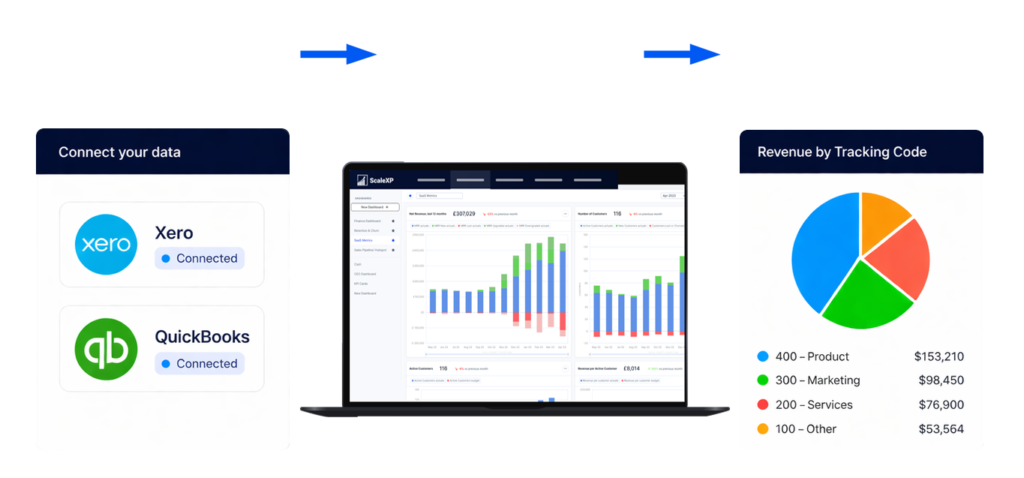
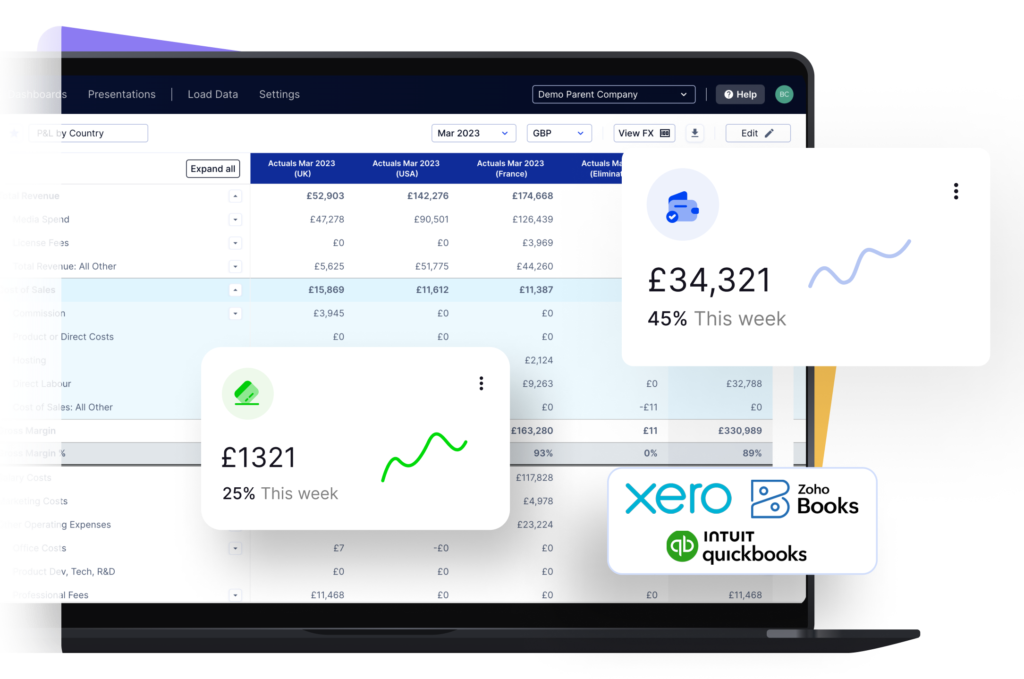
As an official Xero partner app, ScaleXP is built for Xero and QuickBooks users, enabling connected, automated reporting across finance and operations.
Connect Xero and QuickBooks reporting with operational data
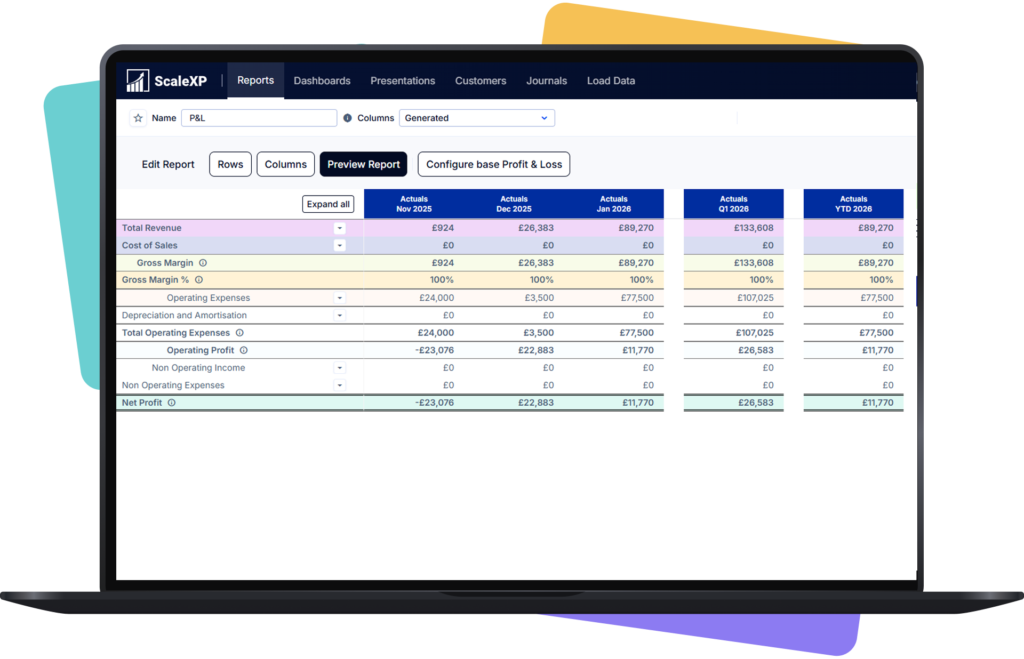
Build dashboards and board-ready reporting from live data
Report by Xero Tracking Codes, QuickBooks Classes, and QuickBooks Locations
How It Works
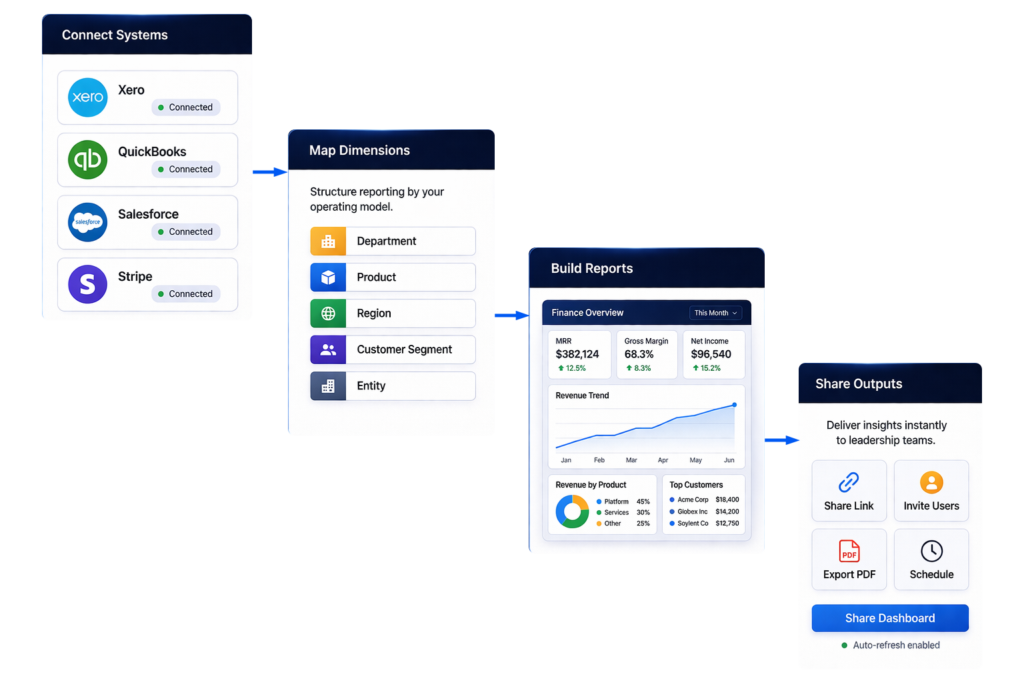
Connect systems: Bring together accounting, billing, CRM, and performance data in one reporting environment.
Map dimensions: Structure reporting by department, product, region, customer segment, or entity.
Build reports: Create dashboards, KPI views, and board reporting layouts around your operating model.
Refresh automatically: Reports update as source data changes, without manual spreadsheet rework.
Share outputs: Give leadership teams current dashboards and reporting views they can use immediately.
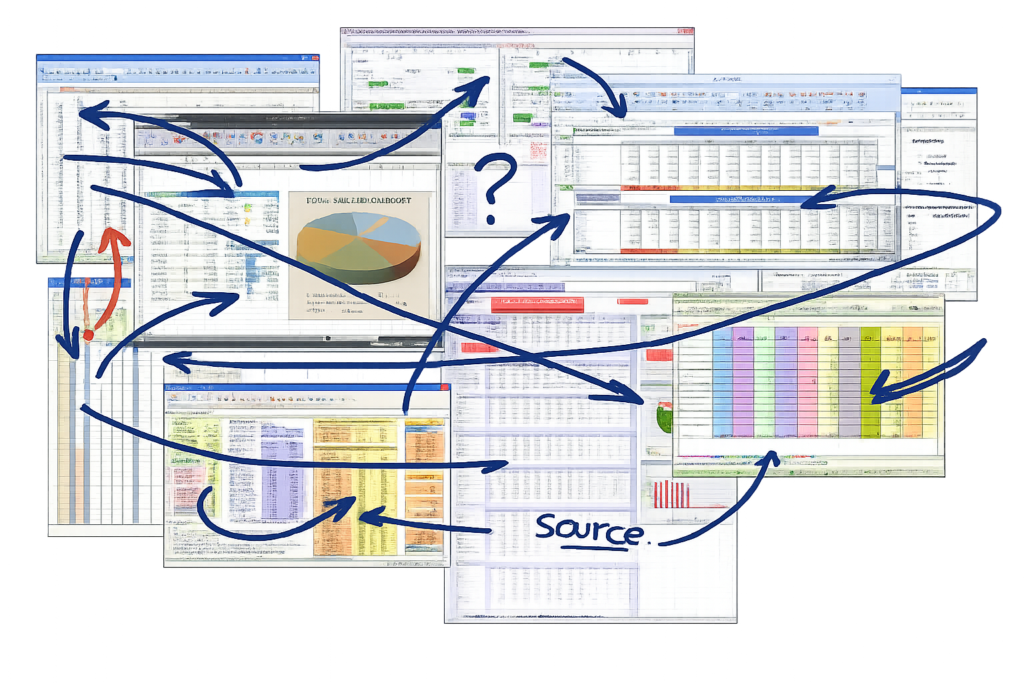
Export data from multiple systems into spreadsheets
Rebuild charts and KPI packs each reporting cycle
Check formulas and versions before every meeting
Answer leadership questions with follow-up analysis later
After ScaleXP
Pull reporting from connected live data sources
Update KPI packs without rebuilding spreadsheets
Use one reporting structure across teams and periods
Share current dashboards for board and management reviews
Faster Reporting Cycles
ScaleXP reduces manual assembly work in recurring reporting cycles. Finance teams spend less time collecting data and more time reviewing performance and explaining change.
Fewer manual exports before board and management reporting
Less spreadsheet maintenance across recurring KPI packs
Faster updates when actuals or forecasts change
More time for analysis and stakeholder discussion
Stronger Reporting Control
Live reporting from connected systems improves control over definitions, calculations, and reporting structure. Finance can work from one governed version of the numbers.
One reporting layer across finance, billing, and CRM
Fewer handoffs between spreadsheets and presentation files
Consistent reporting logic across departments and periods
Clearer ownership of financial outputs
Better Leadership Visibility
ScaleXP helps finance deliver reporting that leadership can use quickly. Current dashboards and structured outputs make performance easier to review and discuss.
Board-ready outputs built from live data
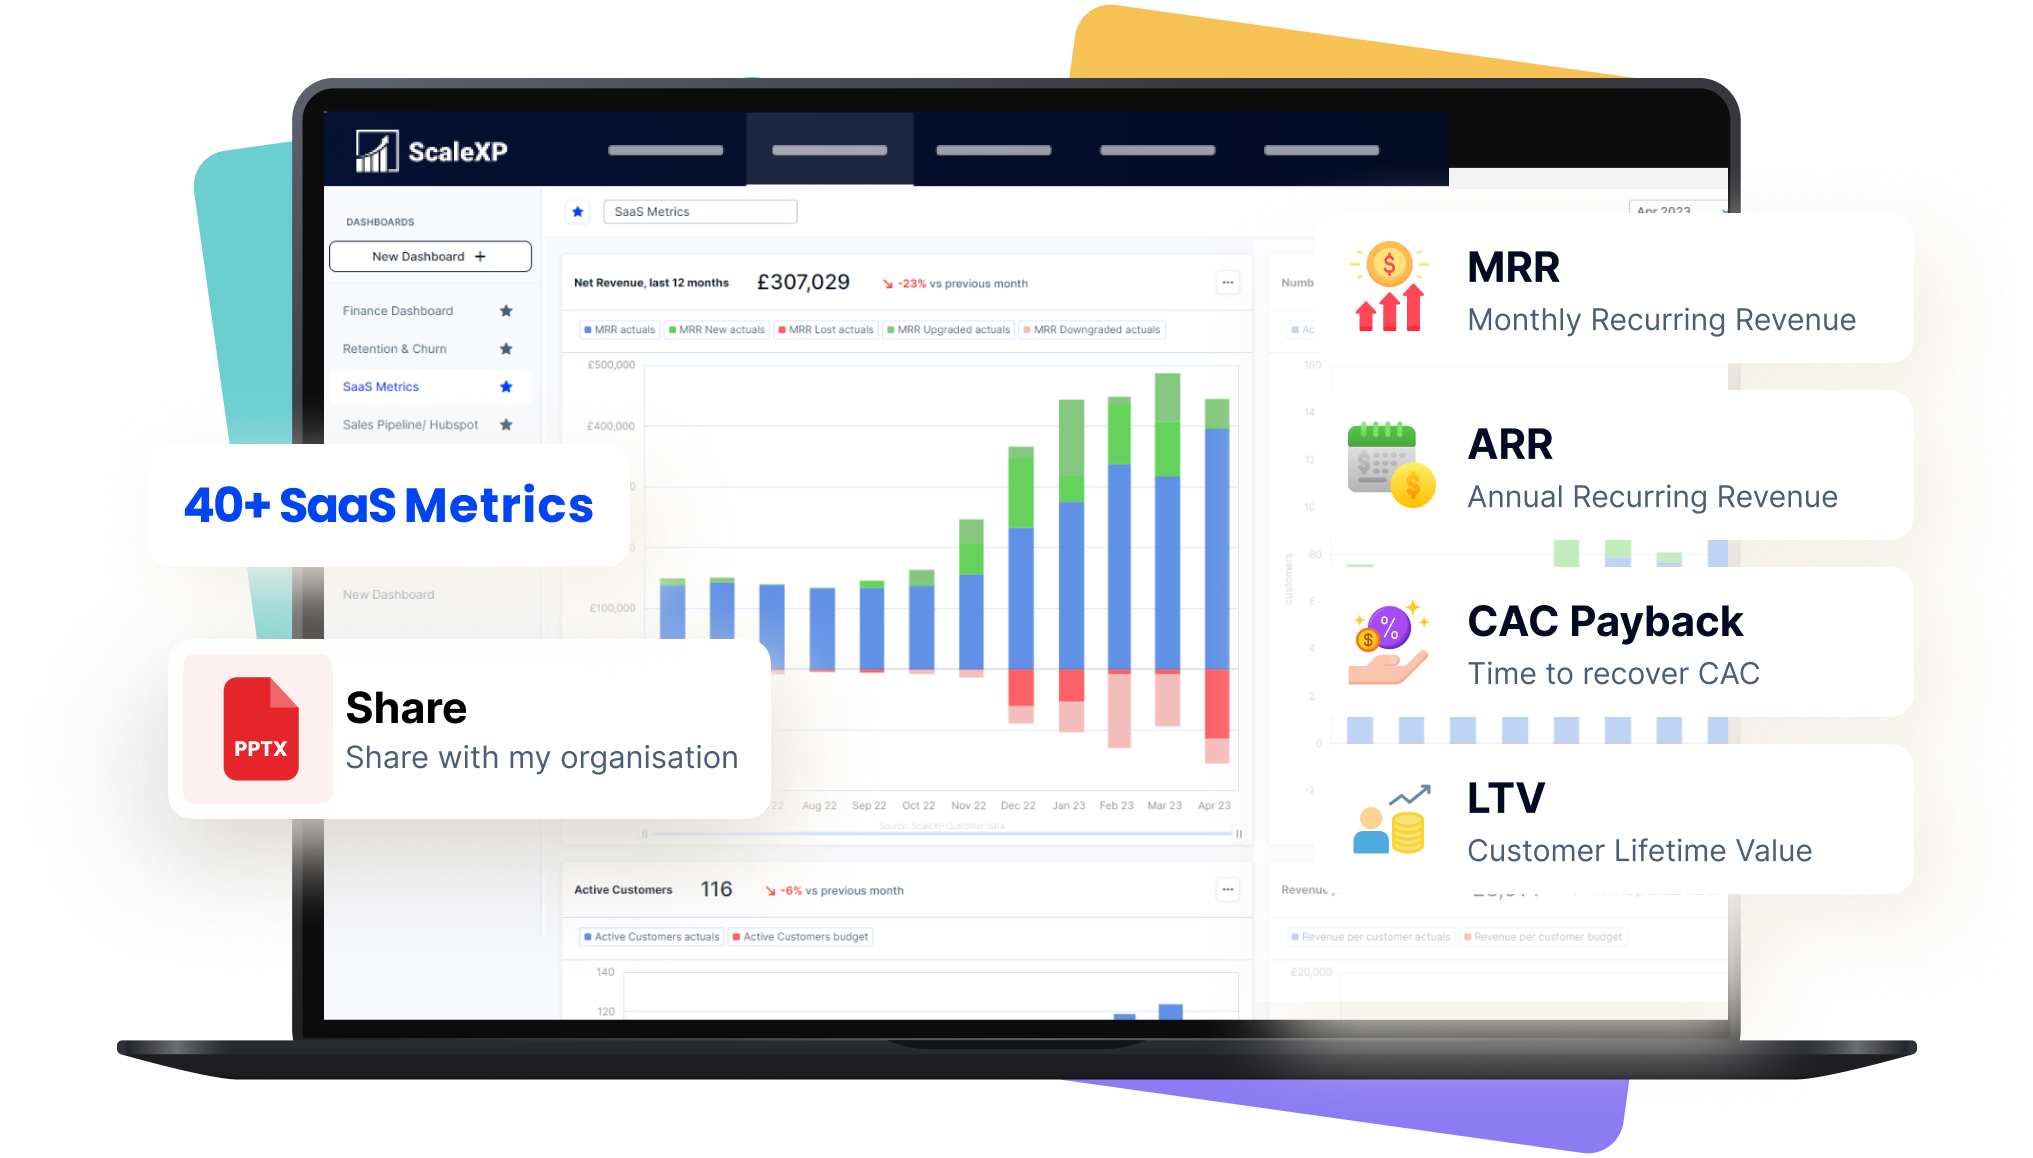
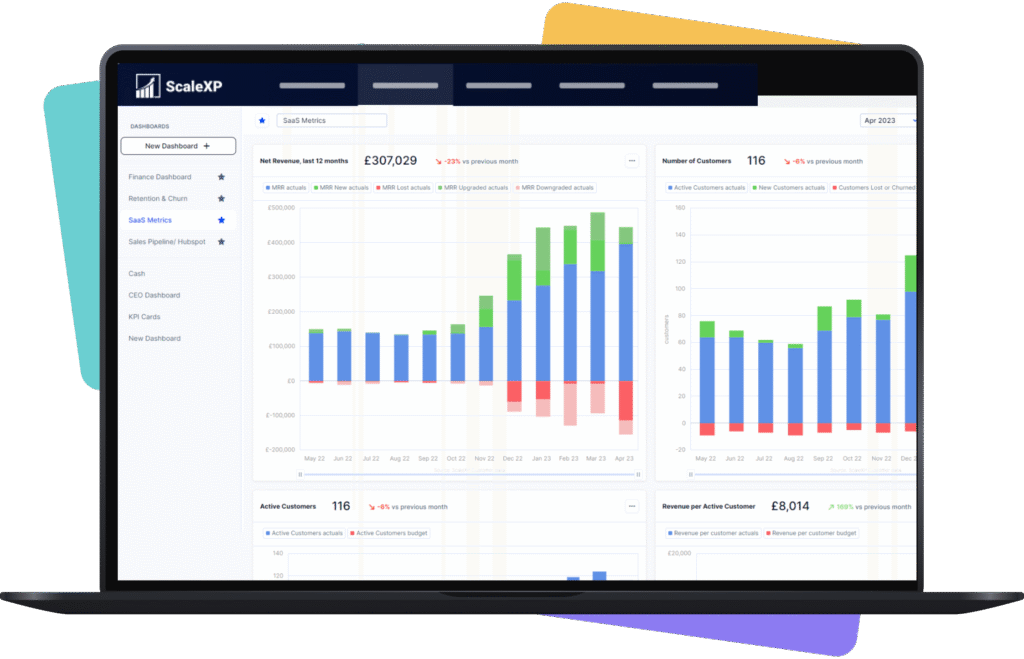
Current views of revenue, cash, and SaaS metrics
Easier drill-down by product, segment, or business unit
Better alignment across finance, CEO, and board
With the ScaleXP platform, you can:
Build live reporting your board trusts: Create reporting from connected data sources, not manual spreadsheet packs. Keep leadership reviews grounded in current numbers.
Reduce spreadsheet reporting risk: Replace repeated exports, manual updates, and version confusion with a more controlled reporting workflow.
Give finance more time for analysis: Spend less time assembling reports and more time explaining performance, variance, and next actions.
Trusted by finance teams
ScaleXP is rated 4.9 stars on the Xero and QuickBooks app stores by finance teams who’ve replaced manual reporting with live, connected dashboards.
These ratings come from finance teams who have moved away from time-consuming manual reporting and now rely on live, fully connected dashboards to manage their data more efficiently.
Controllers improving reporting control across systems
SaaS finance teams tracking MRR, ARR, churn, and cash
SMEs using Xero or QuickBooks for core finance reporting
Trusted by Finance Teams Who Cannot Afford Errors
This software integrates really well with xero and is now our primary tool for consolidation, revenue recognition, calculating saas metrics, prepayments, month end reporting of P&L, BS, & cash flow. It's basically automated a lot of the more challenging month end processes that a subscription based software business faces, and which xero doesn't have the functionality to tackle.
It automates key SaaS metrics and financial reporting, saving us hours each month and making our data much more reliable. The integration with our accounting and CRM tools is smooth and effective.
FAQs
What is smart reporting software?
Smart reporting software helps finance teams create live reports from connected business systems instead of building reporting manually in spreadsheets. ScaleXP smart reporting software brings together accounting, billing, CRM, and performance data so teams can produce current dashboards, board reporting, and management reports with stronger control.
Can ScaleXP create real-time financial reporting from Xero and QuickBooks?
Yes. ScaleXP supports real-time financial reporting by connecting Xero and QuickBooks with other business data sources. Reports update as source data changes, helping finance teams deliver current reporting for management, board, and operational reviews without rebuilding spreadsheets each cycle.
Does ScaleXP support Xero Tracking Codes and QuickBooks Classes?
Yes. ScaleXP supports reporting by Xero Tracking Codes and QuickBooks Classes. This helps finance teams analyse performance by department, region, business unit, or other reporting dimensions that already exist in the accounting structure.
Does ScaleXP support QuickBooks Locations in reporting?
Yes. ScaleXP supports reporting by QuickBooks Locations. Finance teams can use location-based reporting to structure dashboards and management reporting around how the business actually operates, without creating separate spreadsheet models for each view.
Is ScaleXP suitable for board reporting tools and management reporting?
Yes. ScaleXP is well-suited to board reporting tools and management reporting workflows. Finance teams can build structured, board-ready outputs from live data, reducing manual preparation and helping leadership review current performance with greater confidence.
How does ScaleXP reduce manual reporting work?
ScaleXP reduces manual reporting work by connecting source systems, updating reports automatically, and replacing repeated spreadsheet handling. Finance teams no longer need to export data, rebuild charts, and check multiple versions before each reporting cycle.
Can ScaleXP help SaaS finance teams report on MRR and ARR?
Yes. ScaleXP supports SaaS finance reporting needs, including MRR, ARR, churn, cash, and related performance views. This makes it easier for finance leaders to deliver current SaaS metrics to CEOs, boards, and department leaders from one reporting environment.
What changes operationally for the finance team?
Operationally, the finance team moves from collecting and stitching data together to reviewing and managing one reporting layer. That change improves reporting consistency, reduces spreadsheet dependence, and makes recurring reporting more systematic and easier to govern.
Ready to transform data to insight?
Getting started with ScaleXP is easy! Try it for yourself free for 7 days. Or, if you have specific questions, just use the button to the right to schedule a quick meeting.