Cash Generated, or Cash Burn for companies not yet making a profit, refers to the amount of cash the company is either generating or using (“burning”) after taking into account revenue and covering its operating expenses, investments, and other cash outflows over a specific time period.
What is Cash Runway?
Cash Runway is the amount of time, at current Cash Burn run rate, until a company runs out of cash.
How is Cash Burn calculated?
Cash Generated, or Cash Burn, is calculated as the difference between the company’s cash inflows (such as sales revenue) and its cash outflows (such as product costs, operating expenses, research and development costs, etc.) over that period. Financing flows such as loans and investment are excluded, but ongoing financing costs such as interest expense are included.
For companies that are not yet covering their expenses, the Cash Burn rate is expressed as a negative value, representing the net cash outflow during a given period.
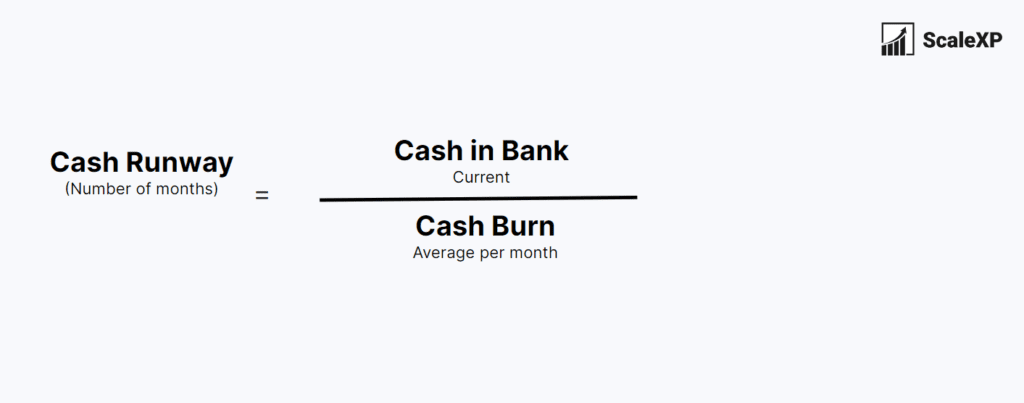
The formula is:
As in the above example, the current monthly rate of Cash Generated or Cash Burn is often generated using average data over the past year, to smooth out any one month anomalies in run rate.
How is Cash Runway calculated?
Cash Runway is generally expressed in number of months and is calculated as the amount of available cash divided by the current Cash Burn rate.
The formula for calculating cash runway is Cash in Bank, divided by Cash Burn, as shown below.
Automate Cash Burn and Cash Runway
Empower your business with real-time, automated SaaS metrics from MRR & ARR to acquisition costs.
How are Cash Burn and Cash Runway used by SaaS companies?
SaaS companies, particularly those which are growing rapidly, generally burn cash rather than generate it. This is because the cost of acquiring each new customer is not recovered immediately after the customer is acquired. SaaS companies often prioritise growth and market penetration over short-term profitability and cash generation. Monitoring cash burn helps the company make the necessary decisions to ensure long-term viability.
Measuring payback time for acquiring new customers, or CAC Payback, is a key component of understanding Cash Burn rates. Read more about CAC Payback here.
What are SaaS Cash Burn benchmarks?
What are the benchmarks and how much cash do SaaS companies burn? Read more about Cash Burn benchmarks in our Cash Burn Benchmarks blog here.
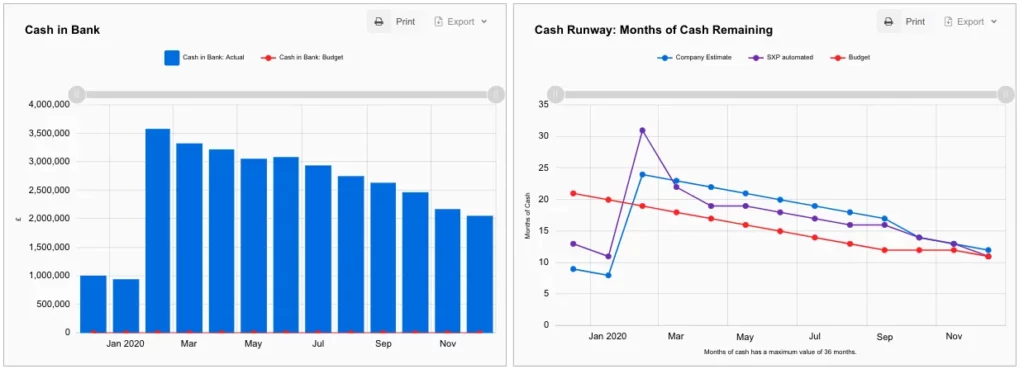
Cash Burn Visualisation Examples
At ScaleXP, the leading SaaS metrics tool, we have automated cash runway and related cash burn metrics using a range of inputs, including your current bank balance, recent cash burn rate, working capital, budget, and forecast, allowing you to monitor the data in a single click each month.
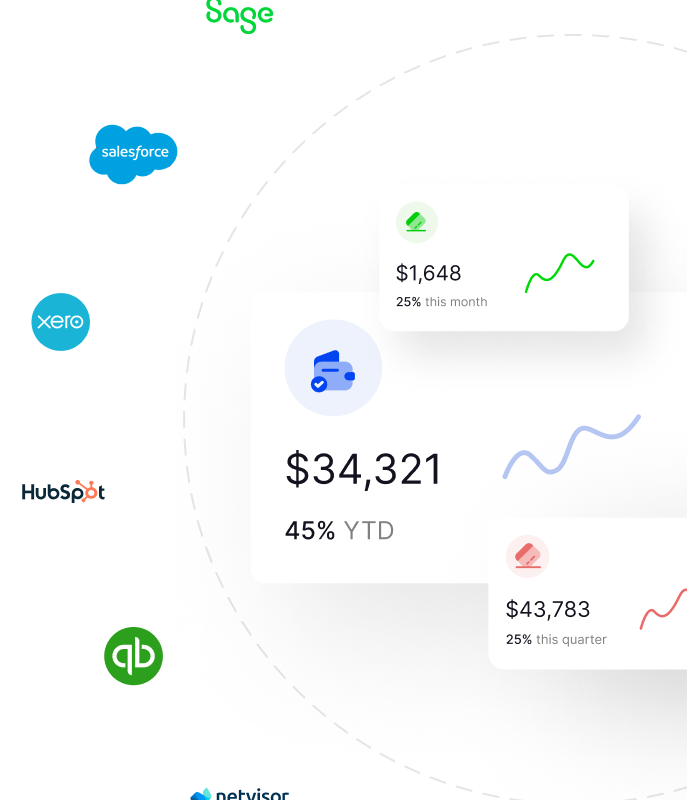
Automate all your SaaS KPIs through integrated data
Connect and combine data from a wide range of accounting & sales CRM systems. Use integrated data to create a comprehensive, fully automated suite of SaaS metrics.
Click below to understand if ScaleXP connects to your systems.
Getting started with ScaleXP is easy! Try it for yourself free for 7 days. Or, if you have specific questions, just use the button to the right to schedule a quick meeting.