


How to automate prepaid expenses
Automating prepaid expenses, the costs a business pays upfront for future goods or services, not only saves time but also
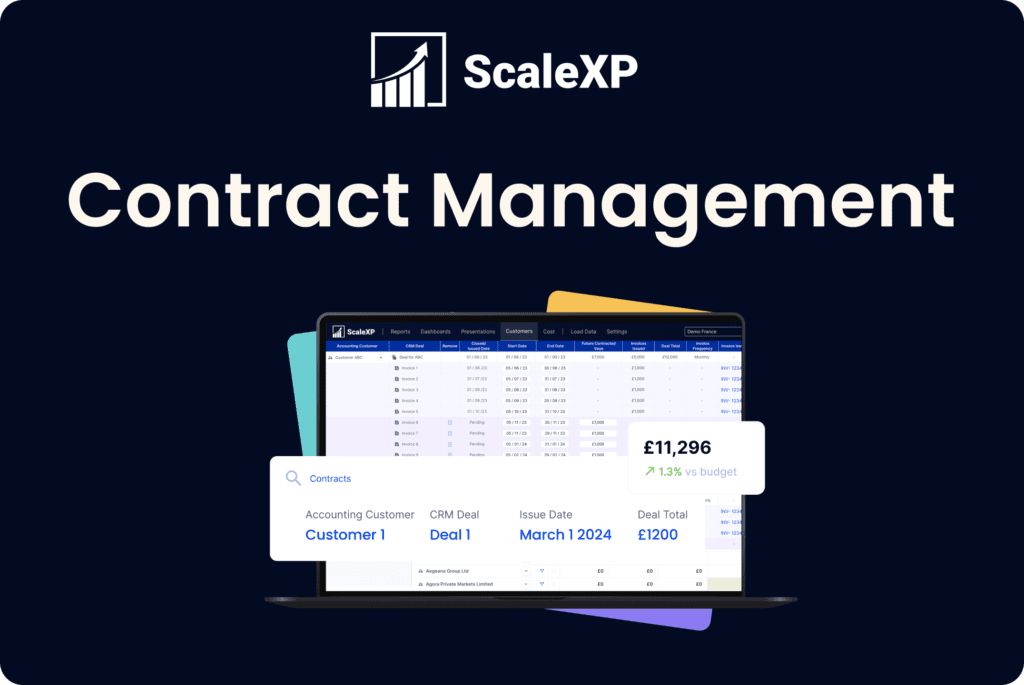
How to automate Hubspot invoicing in QuickBooks
Easily invoice Hubspot deals in QuickBooks using ScaleXP Looking to streamline your invoicing process between HubSpot and QuickBooks? If your
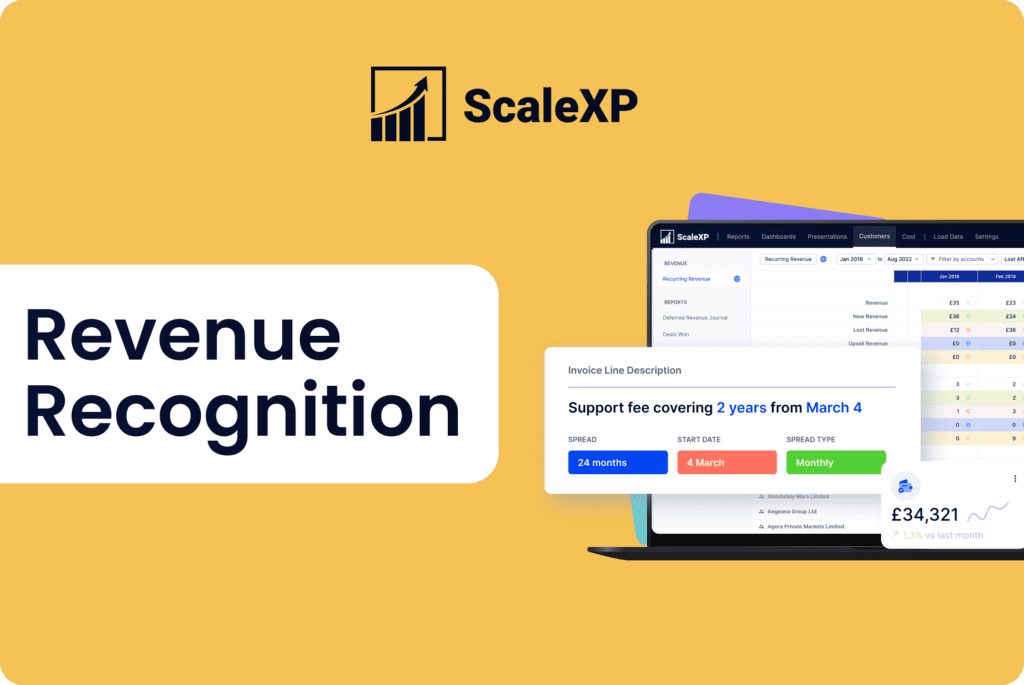
Revenue recognition automation
Revenue recognition: a guide Revenue recognition is a crucial aspect of financial reporting, ensuring that companies accurately reflect their earned


