Committed Monthly Recurring Revenue icon

What is CMRR?

CMRR stands for Committed Monthly Recurring Revenue. It is a forward-looking SaaS metric that combines Monthly Recurring Revenue (MRR) with known changes in subscriptions, bookings and churn.

For businesses who sell annual contracts, CMRR is calculated using annual subscriptions, and this is frequently called CARR or committed annual recurring revenue.

How is CMRR calculated?

The most common definition of CMRR is prior period MRR, adjusted for all known changes in subscriptions, including new and lost subscriptions as well as upsells or downgrades.

Committed Monthly Recurring Revenue formula
An image showing the calculation method for CMRR

Automate CMRR

Empower your business with real-time, automated SaaS metrics from CMRR, MRR & ARR to acquisition costs.

How is CMRR used by SaaS companies?

SaaS companies use CMRR to measure the growth and predictability of their revenue streams. This helps them to make better business decisions, and to plan for future growth.

What is the difference between CMRR and CARR?

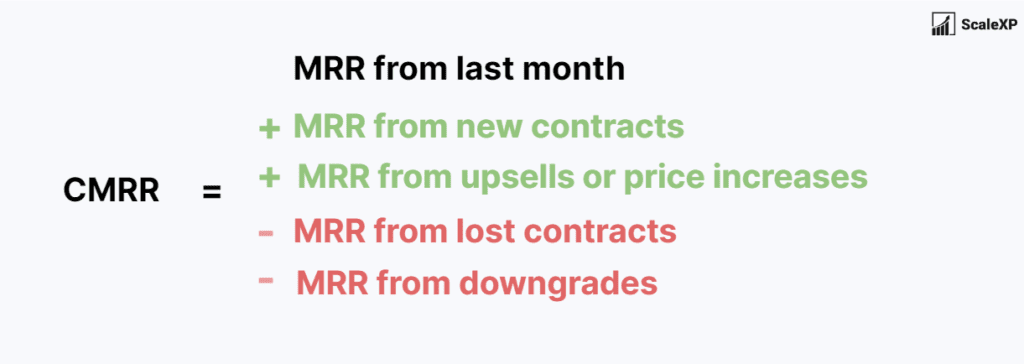
CMRR is committed monthly recurring revenue while CARR is committed annual recurring revenue. CARR, despite the name, can also be used for quarterly calculations.

What is a good CMRR?

A good CMRR depends on the specific business and stage of growth. Rather than assessing absolute CMRR, it is more common to assess the change in CMRR. A CMRR which increases consistently and continuously is positive. The larger the increases in CMRR, the better, as this indicates strong growth in revenue and low churn. 

What are the CMRR benchmarks?

CMRR is not widely benchmarked. The closest equivalent is ARR or MRR Growth Rate; both of which are widely benchmarked. 

Our article on MRR benchmarks for the last three years – 2020, 2021 and 2022 is a good summary. This table shows the key data by company size.

Committed Monthly Recurring Revenue formula

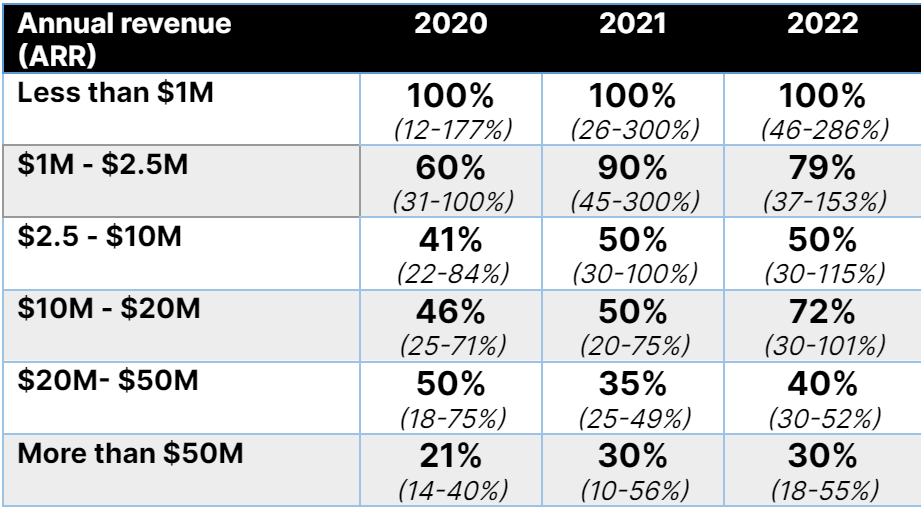
To read the table, identify the row with annual revenue for your company. The following three columns show benchmarked data for 2020, 2021 and 2022. The number in bold is the average revenue growth rate for SaaS companies. The lower number is the MRR growth rate for the lowest performing quartile of companies, while the highest number is the top quartile.

This data is compiled by OpenView and included over 600 companies globally. It is one of the largest and most credible SaaS benchmarking studies.

CMRR Visualisation Example

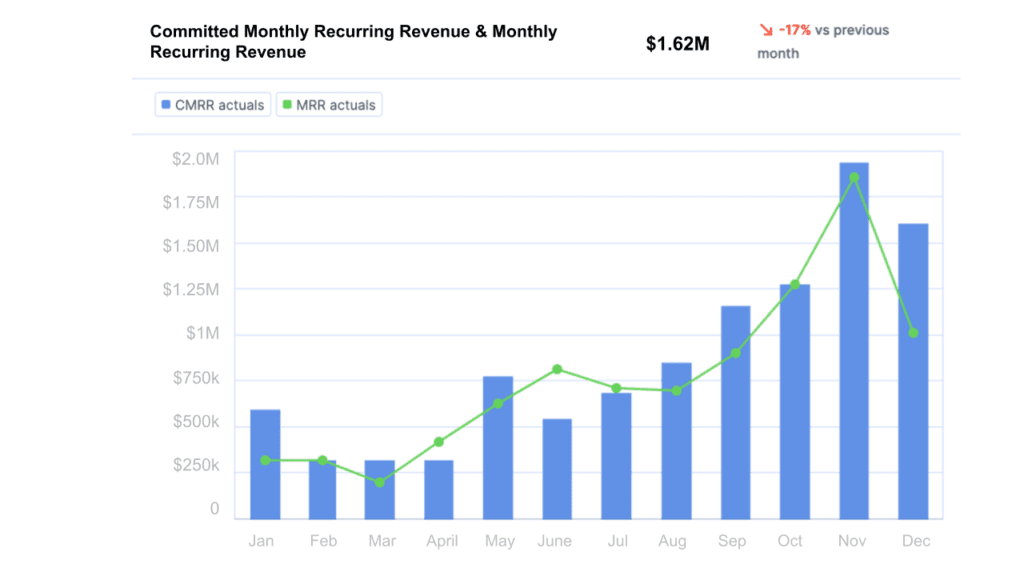
ScaleXP fully automates MRR and CMRR. Using a series of smart test recognition algorithms, revenue is split into New, Lost, Upsells and Downgrades. This provides both aggregate numbers and a breakdown of the key drivers. 

Committed Monthly Recurring Revenue graph

Charts are built to show performance over time, by month, quarter, or year. This data makes it easier for SaaS companies to track performance easily and without the need for detailed spreadsheets.

You may also be interested in

Customer Lifetime Value icon

MRR Growth Rate

Percentage increase in MRR over a certain period of time, most typically a quarter or a year.

Revenue Growth Rate icon

Revenue Growth Rate

Percentage increase in revenue over a certain period of time, most typically a quarter or a year.

ARR icon

ARR

Predictable revenue that a company can expect to receive on an annual basis from its subscription-based products or services.

SAAS METRICS LIBRARY

Read about more SaaS metrics, from ARR to Rule of 40.