See how ScaleXP works with Xero, QuickBooks or Zoho Books.
In a 30-minute demo, we’ll show the relevant workflows using example data and discuss how they could apply to your finance process. Complex requirements? Discuss them with us first.
Understand annual recurring revenue, calculate it with your own numbers, see how ARR per employee benchmarks against other SaaS companies, and get practical tips to improve it. ScaleXP calculates ARR and 30+ other SaaS metrics straight from your accounting and CRM data, prepared daily.

This article will provide
ARR stands for Annual Recurring Revenue. It is a financial metric that represents the expected annual revenue that a company will generate from its recurring (i.e. ongoing or subscription-based) revenue streams. It is a useful metric for businesses that have a subscription-based model, as it provides a prediction of future revenue based on the current level of recurring revenue.
ARR is calculated by multiplying monthly recurring revenue (MRR) by 12, or by adding up the annualized value of every active recurring contract. The formula is shown below:
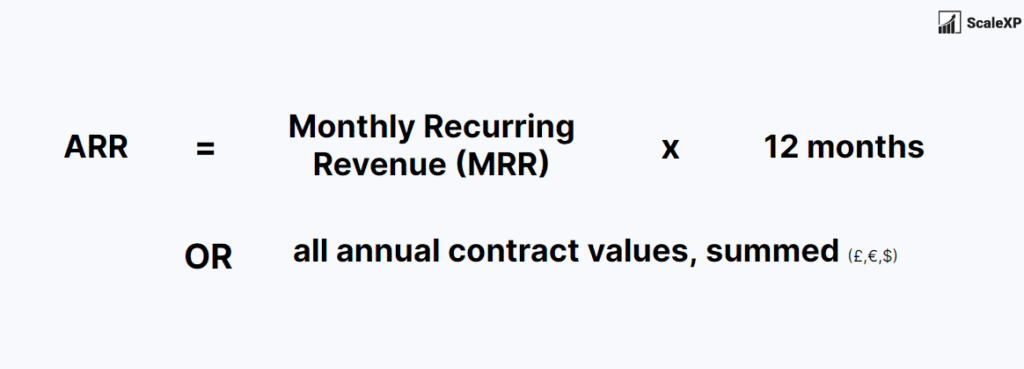
ARR is calculated by taking the total recurring revenue that a company expects to receive in a given month (Monthly Recurring Revenue or MRR) and multiplying it by 12, the number of months in that year. For example, if a company expects to receive $12,000 in recurring revenue per month, its ARR would be $12,000 per month x 12 months = $144,000.
ARR against headcount: $19,300 ÷ $100 ARR in thousands, so the answer is thousands per employee.
Keep reading to see how that compares with the industry benchmark.
Your result
That puts you right at the 2026 median of $193K per employee. The top quartile reaches $279K or higher.
One number against one benchmark only tells you so much. The 2026 benchmark report has the median and top-quartile figures for all 20 metrics, so you can see where the rest of the business sits.
Definitions, formulas, and this year’s median and top-quartile numbers for all 20 metrics in the library. One PDF you can take straight into your next board meeting.
See our privacy policy.
Your report is ready.
Download the 2026 SaaS Benchmark Report We’ve emailed you a copy as well.ARR is a critical metric to track the performance of SaaS companies because it can be used to plan for future growth and investment. It can also be useful for investors and analysts to evaluate the stability and growth potential of a company.
ARR is a particularly important metric for Software as a Service (SaaS) companies, as it provides a way to measure the expected revenue from ongoing subscriptions. SaaS companies typically generate revenue by selling subscriptions to their software products, which are delivered over the internet on a recurring basis.
There are several ways that SaaS companies can use ARR to inform their business decisions:
Recurring revenue is revenue that is expected to be generated on a regular, ongoing basis. This can include subscription-based revenue, such as monthly or annual fees for a service, or revenue from contracts that are renewed on a regular basis. Non-recurring revenue, on the other hand, is revenue that is not expected to be generated on an ongoing basis. It is typically one-time in nature and may include revenue from the sale of a product or the completion of a project.
A good ARR result is judged by growth and efficiency rather than size: how fast ARR is growing, and how much ARR each employee supports. The benchmarks below show what SaaS companies at different revenue levels report.
The most useful ARR benchmark is no longer ARR itself — it is how much ARR each employee supports. That single ratio captures whether growth is being bought with headcount or earned through leverage, and it moved more sharply in 2025 than any other metric in the study.
Median ARR per employee.
| ARR band | Median ARR per employee |
|---|---|
| $20M – $50M | $282K |
| $100M+ | $206K |
The mid-market cohort is the most efficient in the study, running 37% ahead of the largest companies. Scale does not automatically buy efficiency — past roughly $100M of ARR, headcount tends to grow faster than revenue again.
| Cohort | Median ARR per employee |
|---|---|
| Usage-based pricing | $291K |
| Growing over 50% a year | $235K |
| Growing 31–50% a year | $136K |
Source: 2026 Aleph × Benchmarkit SaaS & AI Performance Benchmarks, published 1 June 2026, reporting full-year 2025 actuals from 342 B2B SaaS and AI-native companies. ARR per employee was reported by 96 of them. Growth medians are from SaaS Capital’s 2026 private B2B SaaS growth benchmarks, covering more than 1,000 private companies, with the 342-company Aleph × Benchmarkit sample used as a cross-check.
Keep ARR current
Connect your accounting and CRM data once. ScaleXP updates ARR as contracts are signed, upgraded, renewed or canceled—so finance always has the current recurring-revenue position.
Compare live ARR, contracted ARR and every movement using one consistent, finance-owned definition.
Automate Your SaaS MetricsExample connected ARR view
Live ARR
$1.20m
The annual run rate from active recurring contracts today, based on $100,000 of current MRR.
Illustrative example figures, not your live data.
A high ARR and a steadily increasing ARR are positive indicators of business performance.The most common ARR benchmark is ARR Growth Rate, or the annual increase in ARR. It is certainly one of the top 15 SaaS metrics.
For historical context, the table below reports an earlier global SaaS benchmarking study by OpenView covering 600 VC-funded companies, with data for 2020 to 2022. The left column is annual revenue; the bold figure is the average growth rate for companies of that size that year, and the bracketed figures show the slowest and fastest quartiles. It is useful for seeing the trend into 2022, but the 2026 figures above are the current benchmark.
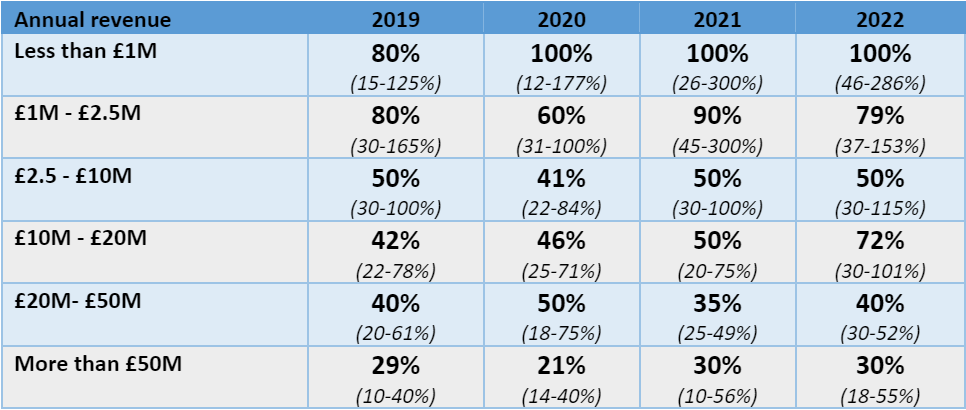
Across 2020 to 2022 growth rates rose for companies of almost every size, the exception being the $20–$50M band. That pattern has since reversed: median growth now sits at 22% across private B2B SaaS — 20% for bootstrapped companies and 25% for equity-backed. A separate 342-company sample puts it at 20% and reports a fourth consecutive annual decline.
To calculate ARR, take every active recurring contract, normalize each one to an annual value, and add them together. For a SaaS business that means the subscription price multiplied by the number of seats, annualized, including contracts billed monthly, quarterly or up front.
Two rules keep the figure honest. Count only committed recurring revenue, and count it at its current value rather than its historic one. Upgrades from existing customers should be reflected as soon as they are contracted, and cancellations removed at the point notice is given rather than when the term finally ends.
Three numbers get quoted as if they were interchangeable, and they are not. They diverge the moment a business bills anything that is not a flat, recurring subscription.
Annual recurring revenue counts only contracted, recurring revenue, normalized to a year. Annual run rate takes whatever the most recent period produced — recurring or not — and multiplies it out. GAAP revenue is what was actually recognized in the period under the revenue recognition rules.
| ARR | Annual run rate | GAAP revenue | |
|---|---|---|---|
| Based on | Contracts in force today | Latest period × 12 | Revenue recognized in the period |
| Includes one-off fees | No | Yes, if they fell in the period | Yes, as they are recognized |
| Direction | Forward looking | Forward, by extrapolation | Backward looking |
| Mainly used for | Valuation and growth | Quick sizing of a business | Statutory accounts |
Run rate is the quickest of the three to calculate and the easiest to overstate, because a single strong month sets the whole annual figure. The difference between ARR and GAAP revenue is a separate question, covered in the section below.
ARR and GAAP revenue answer different questions and rarely match.
GAAP revenue is what has been earned in a period under the applicable accounting standard, recognized across the service period. ARR is a forward-looking run rate: what the current contract base would produce over the next twelve months if nothing changed.
A company signing a large annual contract in December adds the full value to ARR immediately, while GAAP revenue recognizes one twelfth of it that month. Neither figure is wrong, but reporting one as though it were the other is. Investors will ask for both, and for the bridge between them.
Live ARR is annual recurring revenue calculated from your contract base as it stands today, rather than a figure fixed at the last month end. The distinction matters because the two diverge quickly: a company that signs and loses several contracts mid-month has a live ARR that no month-end report reflects yet.
Three versions are in common use, and mixing them causes most reporting arguments:
For a SaaS business the practical rule is to pick one definition, state it beside the number, and use the same one every month. Investors care far less which you choose than whether it stays consistent.
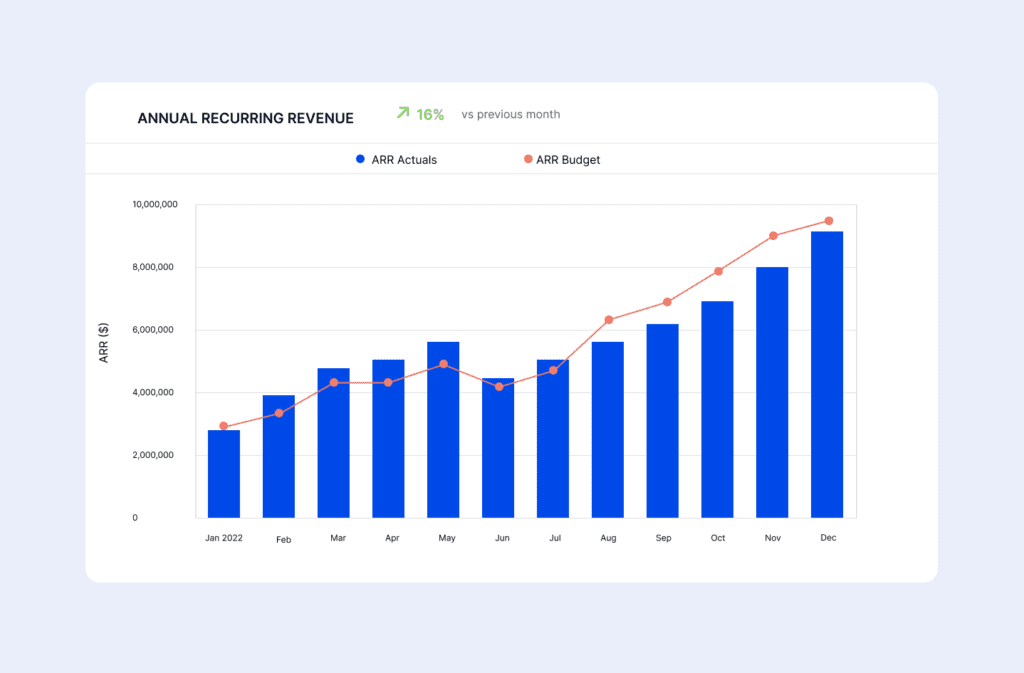
ScaleXP is the leading SaaS finance tool, able to provide a full suite of SaaS metrics, automatically calculated each month. The system connects to and imports data from both your accounting (Xero or Netsuite) and CRM (HubSpot or Salesforce) systems. As data is imported, a series of smart algorithms prepare a revenue recognition schedule and from this, graphs such as these which show both ARR and a budget or latest forecast.
ScaleXP calculates ARR automatically from the systems finance already uses. It connects to Xero, QuickBooks or Zoho Books for invoices and contracts, and to HubSpot, Salesforce or Pipedrive for the commercial record, then builds ARR from active recurring contracts rather than a spreadsheet snapshot. The figure updates as contracts are signed, upgraded, renewed or canceled, and the history is kept, so finance can show the movement between two dates rather than only today’s number.
A good ARR per employee for a B2B SaaS company in 2026 is above the $193K median, with top-quartile companies reaching $279K and the bottom quartile at $126K. The median rose 29% in a year, so a figure that looked healthy before may now trail peers, and companies in the $20M–$50M ARR band stand out at $282K per employee. ScaleXP calculates ARR automatically from accounting and CRM data, giving finance teams a reliable ARR figure to set against headcount and benchmark with confidence.
ScaleXP calculates annual recurring revenue (ARR) automatically from invoices in Xero, QuickBooks or Zoho Books and deal data in HubSpot, Salesforce or Pipedrive. Contract signings, upgrades, renewals and cancellations flow into ARR, and ScaleXP builds the ARR waterfall of new, expansion, contraction, churn and reactivation. Tom, Commercial Analyst at SquaredUp, recalls the old way: “Calculating MRR and ARR alone required half a day each month.” With ScaleXP, finance teams get live ARR without the manual work, and month-end time goes to analysis instead.
ScaleXP keeps ARR consistent with the financial statements because ARR is built from the invoices and journals in Xero or QuickBooks, not from CRM deal values alone. Recurring and non-recurring lines are separated, so one-off fees do not inflate ARR, and finance owns the definitions. Alongside ARR, ScaleXP prepares IFRS 15 and ASC 606 revenue schedules, so the difference between ARR and recognized revenue is visible and explainable. Boards and investors get an ARR figure that reconciles to the management accounts every month.
Yes, ScaleXP shows ARR by customer, segment and cohort in live dashboards and PowerPoint board packs, alongside the ARR waterfall that explains every movement. In presentation mode, directors can drill down from total ARR to the customers behind new business, expansion and churn. ScaleXP displays live ARR, contracted ARR and the movement bridge together, so the board sees what is billed today and what is already signed. Finance teams walk into every board meeting with finance-grade ARR that answers questions on the spot.
For Xero, QuickBooks and Zoho Books
ScaleXP builds ARR from the contracts, invoices and customer changes behind the number. See today’s run rate, contracted movements and the bridge between them—without rebuilding another spreadsheet.
From connected contracts to board-ready ARR
ScaleXP brings together recurring invoices, active contracts and relevant CRM data.

Predictable revenue that a company can expect to receive on a monthly basis from its subscription-based products or services.

Percentage increase in MRR over a certain period of time, most typically a quarter or a year.

A forward-looking view of MRR, usually MRR plus new bookings, less churn.
““producing more insights, faster and with greater accuracy”
SaaS metrics
ScaleXP calculates ARR and 30+ other SaaS metrics straight from your accounting and CRM data, prepared daily.
In a 30-minute demo, we’ll show the relevant workflows using example data and discuss how they could apply to your finance process. Complex requirements? Discuss them with us first.