
See how ScaleXP works with Xero, QuickBooks or Zoho Books.
In a 30-minute demo, we’ll show the relevant workflows using example data and discuss how they could apply to your finance process. Complex requirements? Discuss them with us first.
Understand monthly recurring revenue, calculate it with your own numbers, see what the published growth benchmarks show, and get practical tips to grow it. ScaleXP calculates MRR and 30+ other SaaS metrics straight from your accounting and CRM data, prepared daily.

MONTHLY RECURRING REVENUE
No benchmark exists for MRR itself.
MRR is a level, not a ratio. A median MRR describes the size of the companies surveyed. What is benchmarkable is the rate at which it grows.
2026 benchmark · 1,000+ private B2B SaaS companies
This article will provide
Monthly Recurring Revenue (MRR) is the predictable revenue a business expects every month from active subscriptions.
It gives subscription businesses one consistent way to measure recurring revenue and track growth. It also shows how changes in the customer base feed through to revenue over time.
MRR is the sum of recurring monthly revenue across all active customers. The simplest formula is:
MRR = number of customers × average recurring revenue per customer per month
So a SaaS company with 200 customers paying an average of $150 a month:
200 × $150 = $30,000 MRR
For quarterly or annual subscriptions, normalize the contract value to a monthly figure first. Exclude one-time fees, professional services and any other non-recurring revenue.
Definitions, formulas, and this year’s median and top-quartile numbers for all 20 metrics in the library. One PDF you can take straight into your next board meeting.
See our privacy policy.
Your report is ready.
Download the 2026 SaaS Benchmark Report We’ve emailed you a copy as well.Finance teams use MRR to understand both the size and the direction of recurring revenue.
MRR should still reconcile to the underlying contracts, invoices and accounting records. A growing dashboard number is not reliable if canceled subscriptions, one-time fees or contract changes have been classified incorrectly.
How MRR changes matters as much as the total. Finance teams usually split the movement four ways:
Together these show what is actually driving the change. They separate new business from expansion, contraction and churn.
Reactivation MRR — recurring revenue from customers who previously canceled and have since resubscribed — is tracked separately by some finance teams. Counting it inside New MRR overstates new-customer growth, so where reactivations are material, report them on their own line and state which treatment you use.
A high and steadily rising MRR is a positive signal.
The most common benchmark is MRR growth rate, the annual increase in MRR. It is one of the most important SaaS growth metrics.
What counts as good depends on two things: the customers you sell to, and the size of your business. Our benchmarking article covers both.
MRR on its own is a total, and totals hide their own composition. The benchmarks worth measuring against describe how that total moves — how much is retained, how much is won back through expansion, and what each of those costs.
Median retention across 342 companies.
| Movement | Effect on MRR | What the 2026 benchmarks show |
|---|---|---|
| New | Adds | The most expensive MRR to buy: $1.63 of sales and marketing per $1 of new ARR. |
| Expansion | Adds | Blending expansion in drops the cost to $1.30 — roughly 20% cheaper than winning new logos. |
| Contraction | Subtracts | Counted with churn in gross retention: together they remove 16% of recurring revenue a year. |
| Churn | Subtracts | Gross retention fell from 88% to 84%, and the drop showed up in every quartile. |
Splitting MRR this way changes what you do with it. Expansion is the cheapest recurring revenue available to most companies, and it is the component the median business is now relying on to stay above 100% net retention.
| Cohort | Median gross retention |
|---|---|
| Sales-led | 88% |
| Hybrid | 80% |
| Product-led | 79% |
| Enterprise ($50K–$100K contracts) | 91% |
| Sub-$5K contracts | 80% |
Source: 2026 Aleph × Benchmarkit SaaS & AI Performance Benchmarks, published 1 June 2026, reporting full-year 2025 actuals from 342 B2B SaaS and AI-native companies. Retention figures were reported by 226 of them. Growth medians are from SaaS Capital’s 2026 private B2B SaaS growth benchmarks, covering more than 1,000 private companies, with the 342-company Aleph × Benchmarkit sample used as a cross-check.
Reconcile recurring revenue
ScaleXP builds MRR from invoices and contracts, excludes non-recurring revenue and explains every movement across new business, expansion, contraction and churn.
Reconcile total MRR to customer-level movements and the underlying accounting data.
Automate Your SaaS MetricsExample recurring-revenue view
MRR
$30,000
Recurring monthly revenue from active customers, excluding services and other one-off charges.
Illustrative example figures, not your live data.
The table below shows MRR growth rate benchmarks. Start by finding your annual revenue in the left column.
The row shows the average, the lower quartile and the top quartile.
For companies up to $10M of revenue the average was 50%. The bottom quartile grew 30%; the top quartile grew 115%.
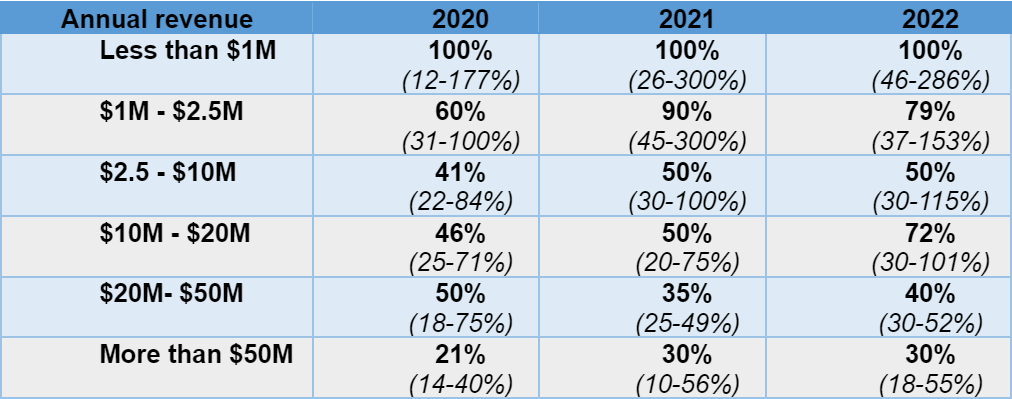
Three things stand out:
The data was compiled by OpenView VC from 600 companies worldwide, from pre-revenue to $100M ARR. All are VC-funded, so growth runs higher than a bootstrapped business should expect.
These figures cover 2020 to 2022. For the current picture, the latest benchmarks put median private SaaS revenue growth at 22% — see our 2026 Rule of 40 benchmarks.
ScaleXP calculates a full suite of SaaS metrics automatically, every month.
It connects to your accounting system and your CRM, then builds a revenue recognition schedule from the imported data. Charts like these follow, showing MRR and MRR growth rate split into new, lost, upgrades and downgrades.
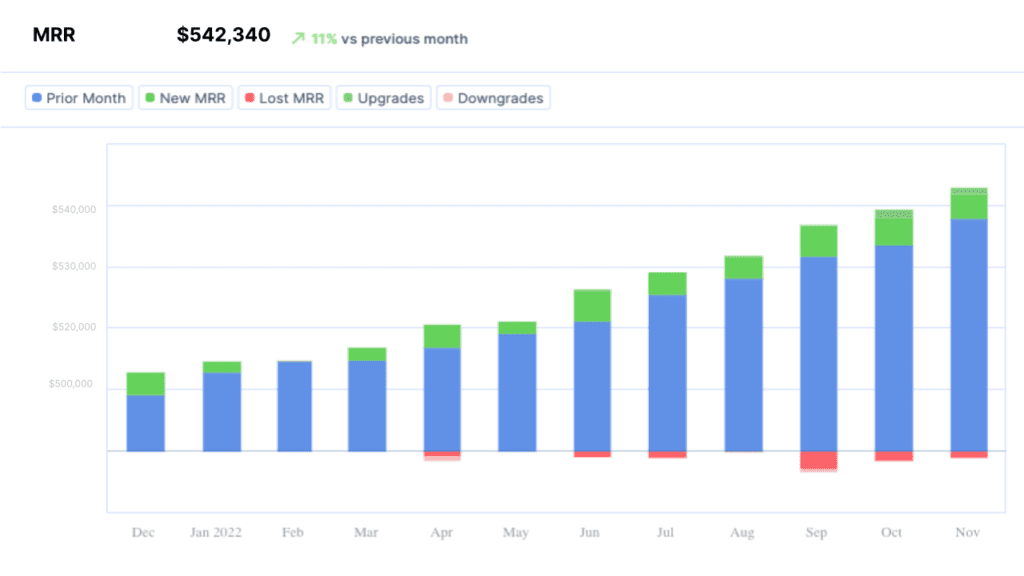
ScaleXP calculates MRR automatically from connected accounting and CRM data. It builds the number from invoices and active contracts in Xero, QuickBooks or Zoho Books, excludes one-off and non-recurring revenue, and explains every movement across new business, expansion, contraction and churn. The calculation runs as each month closes and the history is kept, so finance can reconcile MRR back to the accounts instead of maintaining an offline spreadsheet.
Investors care about monthly recurring revenue (MRR) because it shows the predictable revenue a SaaS business can count on and how quickly that base is growing. They look beyond the headline to the four MRR movements: new, expansion, contraction and churn. In 2026, median net revenue retention is 102% while gross revenue retention is 84%, so investors check whether growth comes from new customers or from expansion covering churn. ScaleXP calculates MRR and every movement automatically, so finance teams can answer those questions with confidence.
Yes, ScaleXP calculates MRR automatically from invoices in Xero, QuickBooks or Zoho Books and deal data in HubSpot, Salesforce or Pipedrive, excluding one-off fees so only recurring revenue counts. ScaleXP classifies every change as new, expansion, contraction or churn MRR. Hannah, Cofounder, says: “It pulls data straight from Xero and HubSpot, and everything just lines up. We’re saving hours each month.” Finance teams replace manual spreadsheets with clean, automated monthly recurring revenue reporting.
ScaleXP makes MRR match the general ledger by building monthly recurring revenue from the invoices and journals in Xero or QuickBooks, then reconciling every movement to the underlying accounts. CRM data from HubSpot, Salesforce or Pipedrive adds customer and contract detail, but the numbers tie back to the books. Finance owns the definitions for upgrades, downgrades and reactivations. The result is an MRR figure the board and auditors can trace, rather than a CRM estimate that drifts away from reported revenue.
Yes, ScaleXP shows MRR by customer, segment and cohort in live dashboards and PowerPoint board packs, alongside the movements of new, expansion, contraction, churn and reactivation MRR. In presentation mode, directors can drill down from total MRR to the customers behind each movement. ScaleXP also feeds MRR and renewals into forecasting, so the board sees where recurring revenue is heading. Finance teams present a clear monthly recurring revenue story every month, prepared without manual spreadsheet work.
For Xero, QuickBooks and Zoho Books
ScaleXP turns contracts, invoices and customer changes into MRR that reconciles to your accounts. See the total, every movement and the customer-level detail—without relying on an offline spreadsheet maintained by one person.
From contracts and invoices to trusted MRR
Connect accounting and, where useful, CRM data so ScaleXP can identify recurring customer revenue.

Predictable revenue that a company can expect to receive on an annual basis from its subscription-based products or services.

Percentage increase in revenue over a certain period of time, most typically a quarter or a year.
““producing more insights, faster and with greater accuracy”
SaaS metrics
ScaleXP calculates MRR and 30+ other SaaS metrics straight from your accounting and CRM data, prepared daily.
In a 30-minute demo, we’ll show the relevant workflows using example data and discuss how they could apply to your finance process. Complex requirements? Discuss them with us first.