See how ScaleXP works with Xero, QuickBooks or Zoho Books.
In a 30-minute demo, we’ll show the relevant workflows using example data and discuss how they could apply to your finance process. Complex requirements? Discuss them with us first.
Understand customer retention rate, calculate it with your own numbers, see what the published retention benchmarks show, and get practical tips to improve it.

CUSTOMER RETENTION RATE
No benchmark for logo retention is published.
A logo retention figure cannot tell a company that kept its largest customers from one that kept its smallest. The published measure is revenue retention.
2026 benchmark · 226 of 342 B2B SaaS companies
This article will provide
Customer retention rate is the percentage of existing customers who remain customers after a given period, generally one year.
To calculate customer retention rate for a period, start with the number of customers at the end. Subtract any new customers won during that period. Then divide by the number you had at the start, and multiply by 100.
Retention is usually quoted as an annual figure. If you are working from quarterly or monthly data, raise the rate to the power of the number of periods — 4 for quarters, 12 for months.
A 96% quarterly retention rate becomes 85% across a year, because 0.96 is multiplied by itself four times.
Here is the annual customer retention rate, calculated from annual data.

Customer retention is the opposite of customer churn. It measures the share of customers who stay.
There are several ways to measure it. You can calculate the retention rate as above, track repeat purchases, or measure how long customers keep buying.
For many B2B SaaS companies, customer retention rate means the same thing as logo retention.
Definitions, formulas, and this year’s median and top-quartile numbers for all 20 metrics in the library. One PDF you can take straight into your next board meeting.
See our privacy policy.
Your report is ready.
Download the 2026 SaaS Benchmark Report We’ve emailed you a copy as well.SaaS (Software as a Service) companies rely on customer retention as a key factor in their business model. A high customer retention rate generates consistent, predictable revenue and supports long-term growth.
What counts as a good customer retention rate varies by industry, market, company size and stage of development. No single number applies everywhere.
A high rate that keeps climbing is the signal to look for.
There is no single universal retention benchmark, because retention tracks contract size more closely than almost anything else. Compared within a contract-value band, however, the 2026 data is consistent across studies. The figures below are observed medians from 939 B2B SaaS companies.
Retention varies too much by contract size for a single market average to be useful. Segmented by what customers pay, though, the 2026 data is consistent and unusually clear — and it shows why the monthly figure most teams report can be so misleading.
Compounded annual logo retention, by contract value.
| Average contract value | Monthly retention | Annual, compounded | Common annual target |
|---|---|---|---|
| Under $10k (SMB) | 95.8% | 59.7% | 80–87% |
| $10k–$50k (mid-market) | 97.9% | 77.5% | 87–92% |
| $50k–$100k (upper mid-market) | 98.7% | 85.5% | 92–95% |
| Over $100k (enterprise) | 99.3% | 91.9% | 92–95% |
The last two columns are different kinds of number and should not be read as a like-for-like comparison. The annual figures are observed medians across 939 companies. The target ranges are aspirational guidance published separately. The gap between them at the SMB end — 59.7% observed against an 80–87% target — is the distance between where the median company is and where advice says it should be, not evidence that either figure is wrong.
Gross and net revenue retention are widely published — 84% and 102% respectively across 342 companies — and it is tempting to quote them when a customer-retention figure is wanted. They measure something different. Revenue retention counts dollars; customer retention counts customers. A company can retain 95% of its revenue while losing a third of its customers, if the ones leaving are small. That is precisely what the churn data shows happening at the SMB end of the market, so the substitution fails hardest exactly where the question matters most. See revenue retention separately →
Source: Optifai’s 2026 B2B SaaS churn study, 939 companies segmented by average contract value; retention figures are the inverse of the observed logo churn rates. Target ranges from ChurnDefense’s 2026 segment guidance and are stated as targets, not observed medians. Revenue retention figures from the 2026 Aleph × Benchmarkit benchmarks.
See retention over time
A small monthly loss compounds into a much larger annual problem. ScaleXP keeps customer retention current and shows finance how short-term customer movements affect the full-year result.
Compound retention correctly rather than multiplying or averaging monthly percentages.
Automate Your SaaS MetricsExample connected customer-retention view
Monthly customer retention
98.0%
The proportion of the opening customer base retained during one month.
Illustrative example figures, not your live data.
This chart is an example of customer retention shown over two years. Multi-year graphs make it much easier to understand trends, improvements, even seasonality.
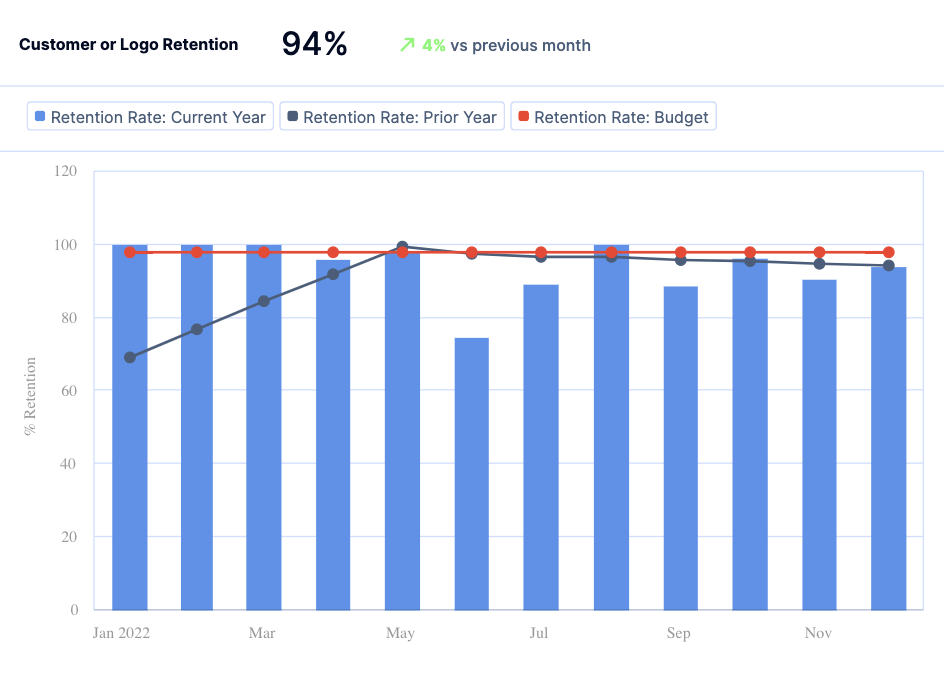
ScaleXP automates customer retention rate calculations. It connects to your accounting and CRM systems and uses text recognition to match records automatically.
The graphs are interactive. You can drill into the detail, right down to a breakdown by customer name.
Retention is one of several SaaS metrics the platform automates. See our SaaS metrics for the full picture.
A B2B SaaS company should target annual customer retention of 80–87% for SMB contracts and 92–95% for enterprise, yet the 2026 benchmarks show actual annual retention of 59.7% for contracts under $10k and 91.9% for contracts over $100k. The gap comes from compounding, because 95.8% monthly retention becomes just 59.7% over a year. ScaleXP calculates customer retention rate automatically from accounting and CRM data, so finance teams track the true annual figure against target rather than a flattering monthly number.
Yes, ScaleXP calculates customer retention rate automatically by matching customers in QuickBooks or Xero with records in HubSpot, Salesforce or Pipedrive. New customers are separated from retained ones, so the retention rate reflects the existing base only. ScaleXP prepares the metric daily alongside 30+ other SaaS metrics, including churn, NRR and GRR. Finance teams stop reconciling customer lists by hand and get a customer retention figure that is current and consistent every month.
ScaleXP keeps logo retention and revenue retention consistent because both are calculated from the same invoices and journals in Xero or QuickBooks. Customer counts and recurring revenue come from one source, so finance can explain why the two diverge, for example when small customers leave and large ones stay. Each view is clearly labeled, so the board does not mistake revenue retention for customer retention rate. The result is retention reporting that ties to the financial statements and holds up to investor scrutiny.
Yes, ScaleXP shows customer retention by cohort in interactive graphs, live dashboards and PowerPoint board packs. Directors can see how each signup cohort holds up over time and drill down in presentation mode to the customers behind every point. ScaleXP turns customer retention rate into an early warning, highlighting cohorts and segments where retention is slipping before it shows up in revenue. Finance teams deliver retention insight the board can act on, without a spreadsheet rebuild each month.
For Xero, QuickBooks and Zoho Books
ScaleXP shows which customers stayed, which left and how retention differs by cohort. Finance gets a current view of customer quality before the annual number reveals the damage.
From customer records to a current retention view
ScaleXP brings together active customers, subscriptions and relevant CRM records.
Related metricscustomer churn raterenewal retention rategross and net revenue retentionnet dollar retention

Customer churn is the percentage of customers who stop doing business with a company or using a service.

Measures growth in revenue from a group of customers. Typically split into upgrades, downgrades, renewals and losses.

Increase in MRR from current customers, calculated from Churned and Downgraded less Upsells.
““producing more insights, faster and with greater accuracy”
SaaS metrics
ScaleXP calculates customer retention and 30+ other SaaS metrics straight from your accounting and CRM data, prepared daily.
In a 30-minute demo, we’ll show the relevant workflows using example data and discuss how they could apply to your finance process. Complex requirements? Discuss them with us first.