MRR is Monthly Recurring Revenue; MRR Growth Rate is the percentage by which a company’s revenue has increased or decreased over a certain period of time, most typically a quarter or a year.
How is MRR Growth Rate calculated?
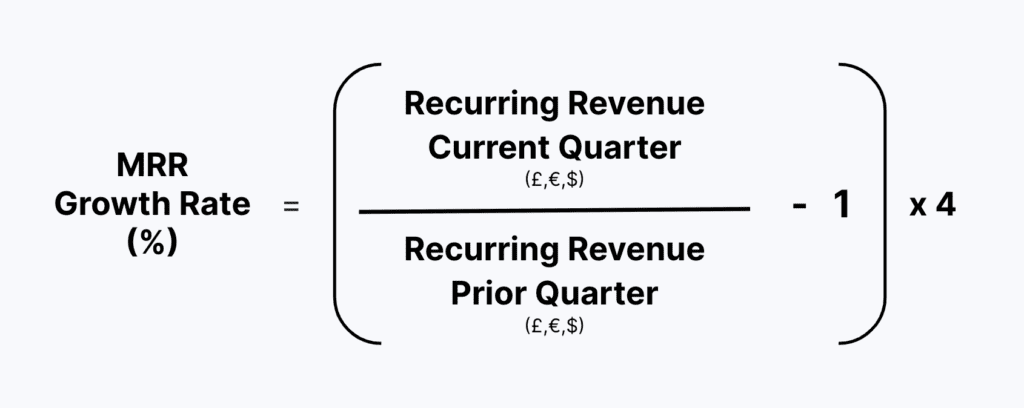
MRR Growth Rate is calculated by dividing the revenue for the current period by the revenue from the prior period and then subtracting 1.
For example, if a company had revenue of $100,000 in 2020 and $120,000 in 2021, its MRR Growth Rate would be calculated as follows: (120,000 / 100,000) – 1 = 0.2 = 20% Annual MRR Growth
In this example, annual figures are used. When revenue is calculated over a quarter, the result is multiplied by four to get an annual figure.
Automate MRR Growth Rate
Empower your business with real-time, automated SaaS metrics from MRR & ARR to acquisition costs.
What is the difference between recurring and non-recurring revenue?
Recurring revenue is received on a regular basis, such as each month, each quarter or every year. It is more predictable and stable than non-recurring revenue, which tends to be one-off or less regular.
How is MRR Growth Rate used by SaaS companies, and what is a good MRR Growth Rate?
MRR Growth Rates vary widely by industry and company size, so the best indication of performance is frequently an internal comparison to prior quarter or prior year.
This being said, MRR Growth Rates are widely benchmarked.
And so, what are the MRR Growth Rate benchmarks?
The best MRR Growth Rates consider both the size of the SaaS business as well as their target customers. Our article on 2022 MRR benchmarks has full details.
This table provides a quick overview by company size, measured as annual revenue:
Annual revenue
2020
2021
2022
Less than £1M
100% (12-177%)
100% (26-300%)
100% (46-286%)
£1M - £2.5M
60% (31-100%)
90% (45-300%)
79% (37-153%)
£2.5 - £10M
41% (22-84%)
50% (30-100%)
50% (30-115%)
£10M - £20M
46% (25-71%)
50% (20-75%)
72% (30-101%)
£20M- £50M
50% (18-75%)
35% (25-49%)
40% (30-52%)
More than £50M
21% (14-40%)
30% (10-56%)
30% (18-55%)
To read the table, identify the row with annual revenue for your company. The three columns show data for 2020, 2021 and 2022. The number in bold is the average growth rate for SAAS companies of this size. The lower number is the MRR growth rate for the lowest performing quartile of companies while the highest number is the top quartile.
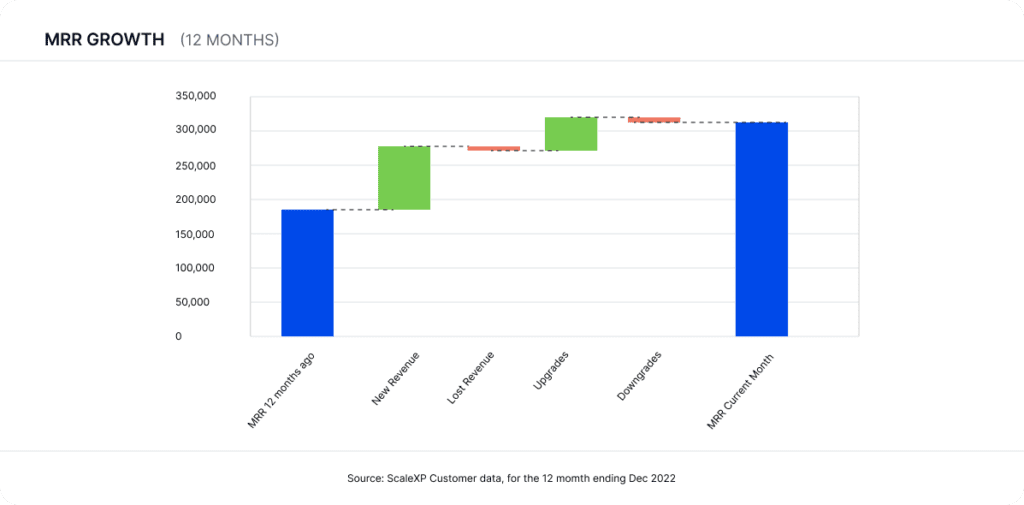
MRR Growth Rate visualization example
This chart is an example of customer churn rate, with year on year comparisons, making it much easier to understand trends, improvements, even seasonality.
ScaleXP fully automates MRR and MRR growth rate calculations. Using a series of smart test recognition algorithms, revenue is split into New, Lost, Upsells and Downgrades.
Charts are built to show performance over time, by month, quarter or year. This data makes it easier for SaaS companies to track performance and focus on driving performance, rather than data compilation.
You may also be interested in
MRR - MONTHLY RECURRING REVENUE
A forward looking view of MRR, usually MRR plus new bookings less churn.
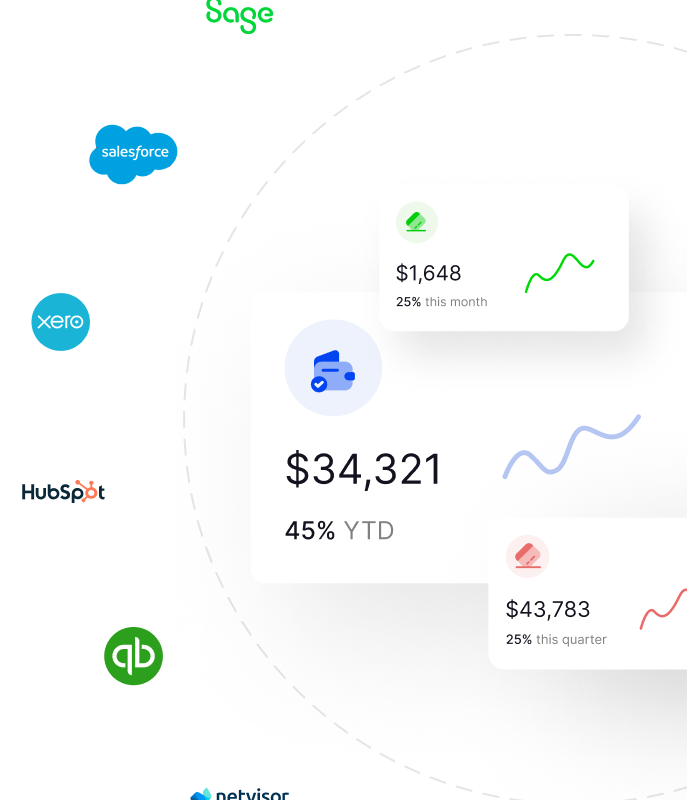
Automate all your SaaS KPIs through integrated data
Connect and combine data from a wide range of accounting & sales CRM systems. Use integrated data to create a comprehensive, fully automated suite of SaaS metrics.
Click below to understand if ScaleXP connects to your systems.
Getting started with ScaleXP is easy! Try it for yourself free for 7 days. Or, if you have specific questions, just use the button to the right to schedule a quick meeting.