


A cohort is a group of people who share a common characteristic over a certain period of time. Cohort analysis originated in science but was adapted to business as a tool to understand customer behaviour.
Strategic business decisions rely on in-depth, high-quality data — and the sooner you can access and analyse that data, the sooner forward-looking strategies impact the company. However, to uncover the kinds of insights your business needs, you need the resources and time to pull and analyse the right data.
There are three common variants of cohort analysis:
- Customer retention or churn, which assesses the rate of attrition
- Revenue per month, which shows spend per customer per month; especially critical for any company with a subscription or ‘land and expand’ strategy.
- Cumulative revenue, which is used to determine the average time for a customer to become profitable.
To create a cohort analysis, customers are grouped by their date of acquisition. In most cases, it is best to group customers by month or quarter. Fast moving companies can analyse cohorts by day.
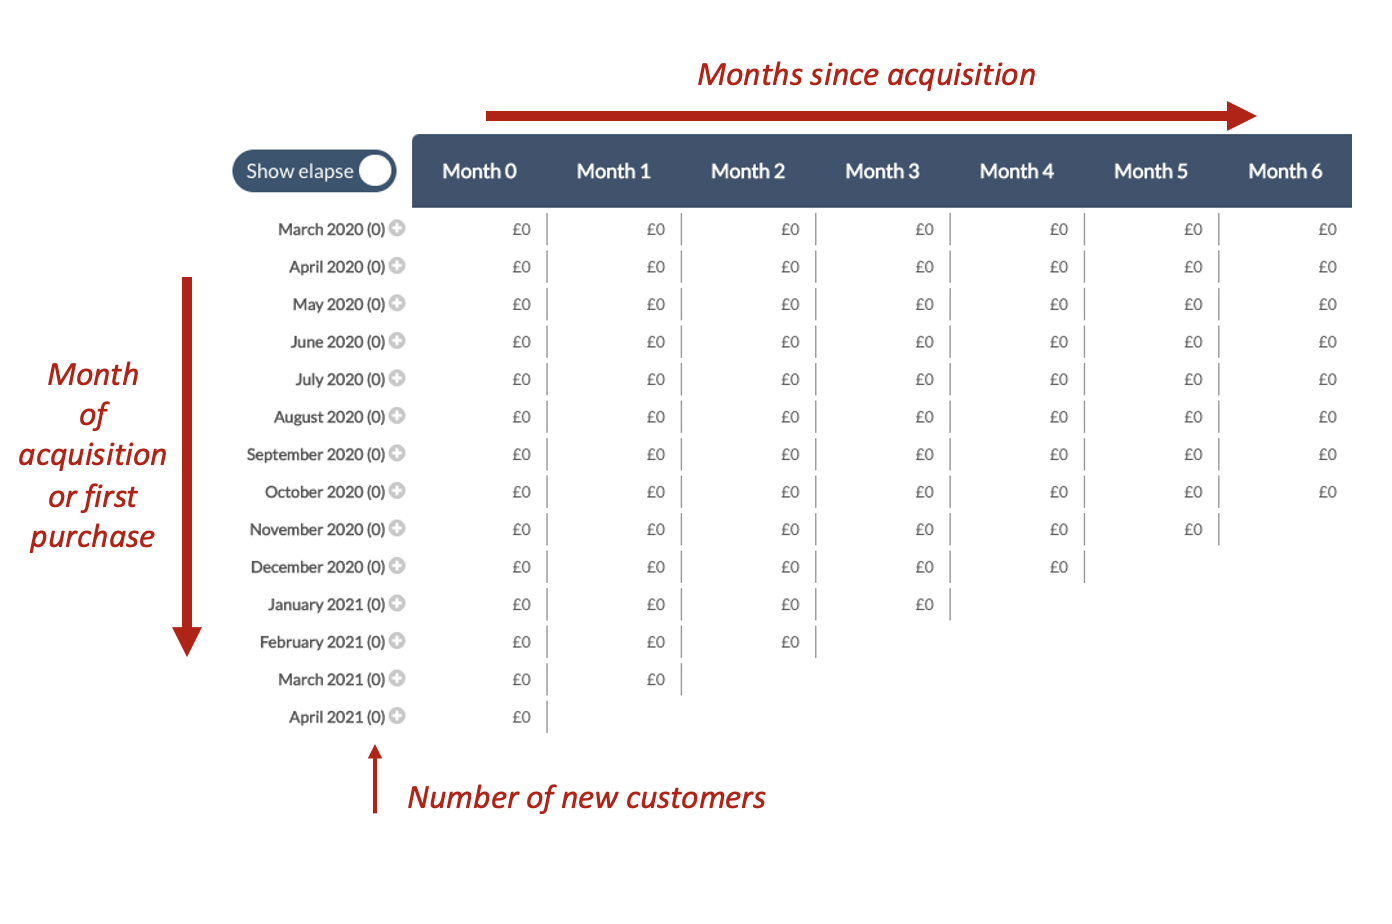
The date of acquisition is displayed on the vertical axis. The horizontal axis shows the months (or quarters or days) since acquisition.
There are two types of cohort analysis: segment-based and time-based. Depending on what financial metric you want to dive deeper into, one may be optimal over the other.
Segment-based cohort analysis
Segment-based cohort analysis produces a “colourful layer cake graph.” If you were to look at your annual recurring revenue (ARR) and segment ARR by different cohorts per year, each year produces a different layer that tells you how much each customer provides in revenue. You want lots of layers, meaning you have plenty of existing customers using your product, but you still want that top layer (the most recent year) to be really high because you want to keep growing and growing fast.
Time-based cohort analysis
Time-based cohort analysis is “the classic” version of cohorting. You’ll see a waterfall along your X-axis, while the Y-axis has some sort of segmentation to dive deeper into NRR and customer lifecycle over a specific period of time. You want to analyse user behaviour to see what works and what doesn’t work. This analysis will help answer questions like “Where do customers begin to downgrade or churn?” and “Where do customers discover the most value of the product — and how can we get them to value it sooner?”
How to get the most out of your customer cohort data
Customer cohort analysis provides deeper insights into data, allowing you to:
- Reveal customer churn patterns: Focus on customer behaviour around churn. Identify potential issues with either onboarding or product/service tier misalignment and report these findings to the customer service, product, and sales departments.
- Drive growth in renewal cycles: Segment your retention metrics (NRR, gross dollar retention, and ARR) by customer cohort to identify behavioural patterns and user experience overall. By identifying these patterns, finance provides insight, so customer success can create proactive solutions.
- Analyse your pricing strategy: If customers are between 90% and 110% NRR after their first year or two, you need to reconsider your pricing strategy. Your pricing must optimise scaling revenue, maximising LTV over time, and providing accurate value for new customers.
Customer retention cohort analysis
Customer retention is an easy way to understand how long clients stay with the company.
Here is an actual example from the ScaleXP system. The numbers highlight that months 1, 2 and 3 have high churn. Customers who make it beyond month 3 stay for 12+ months.
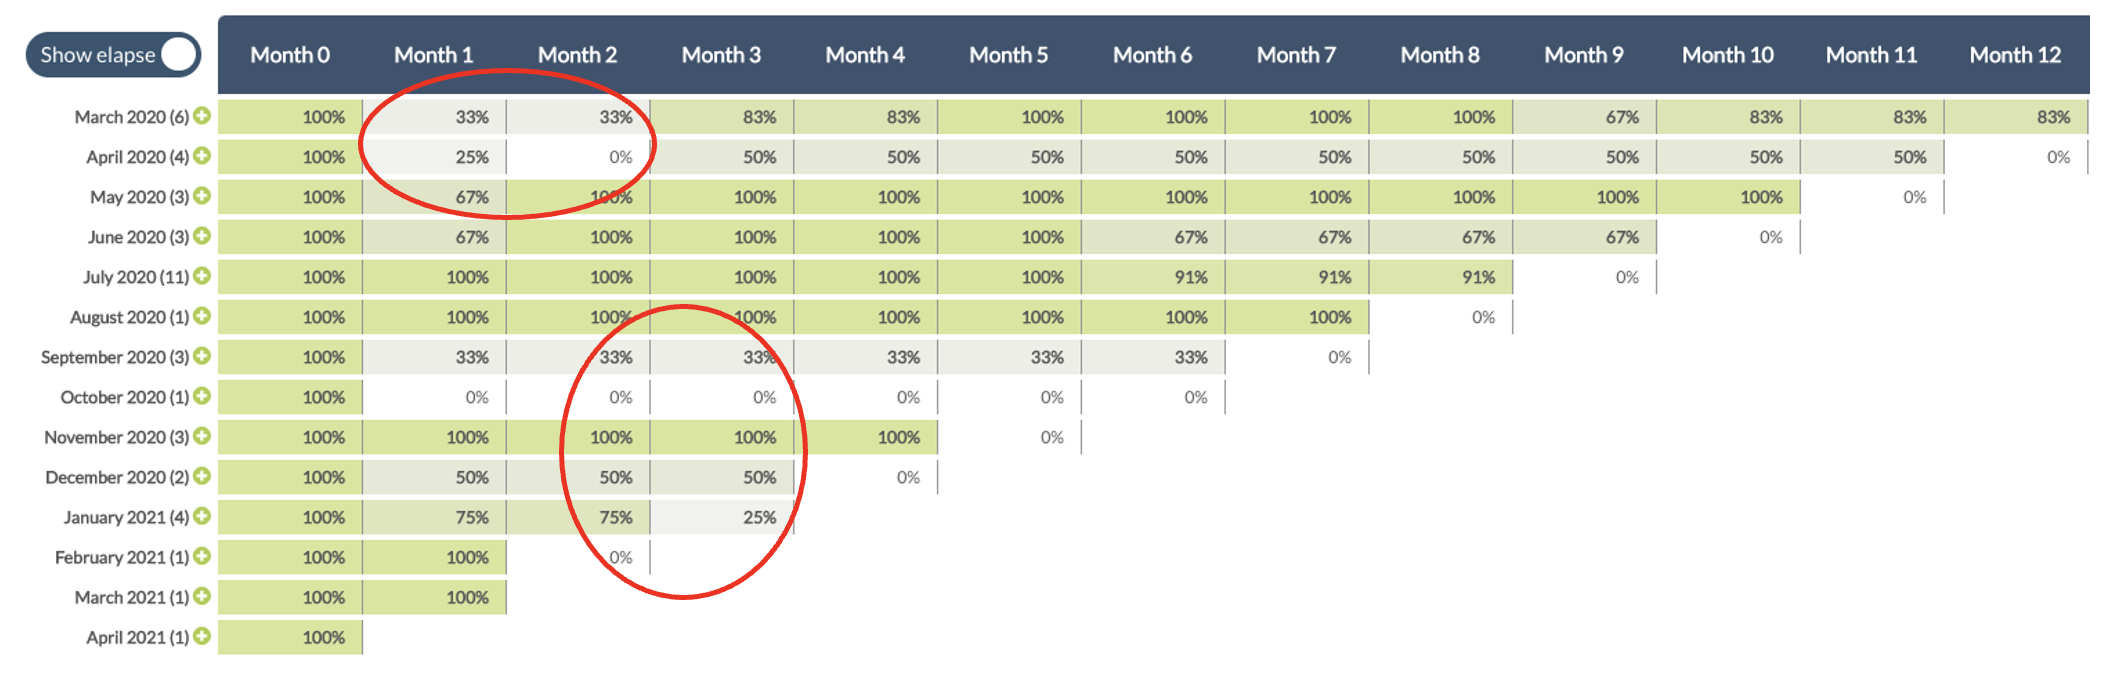
This example also shows that customers acquired recently – since Sept 2020 – are most likely to churn.
Understanding the critical months for churn can allow the company to tailor its customer service programmes in the early months and then monitor the impact of these initiatives.
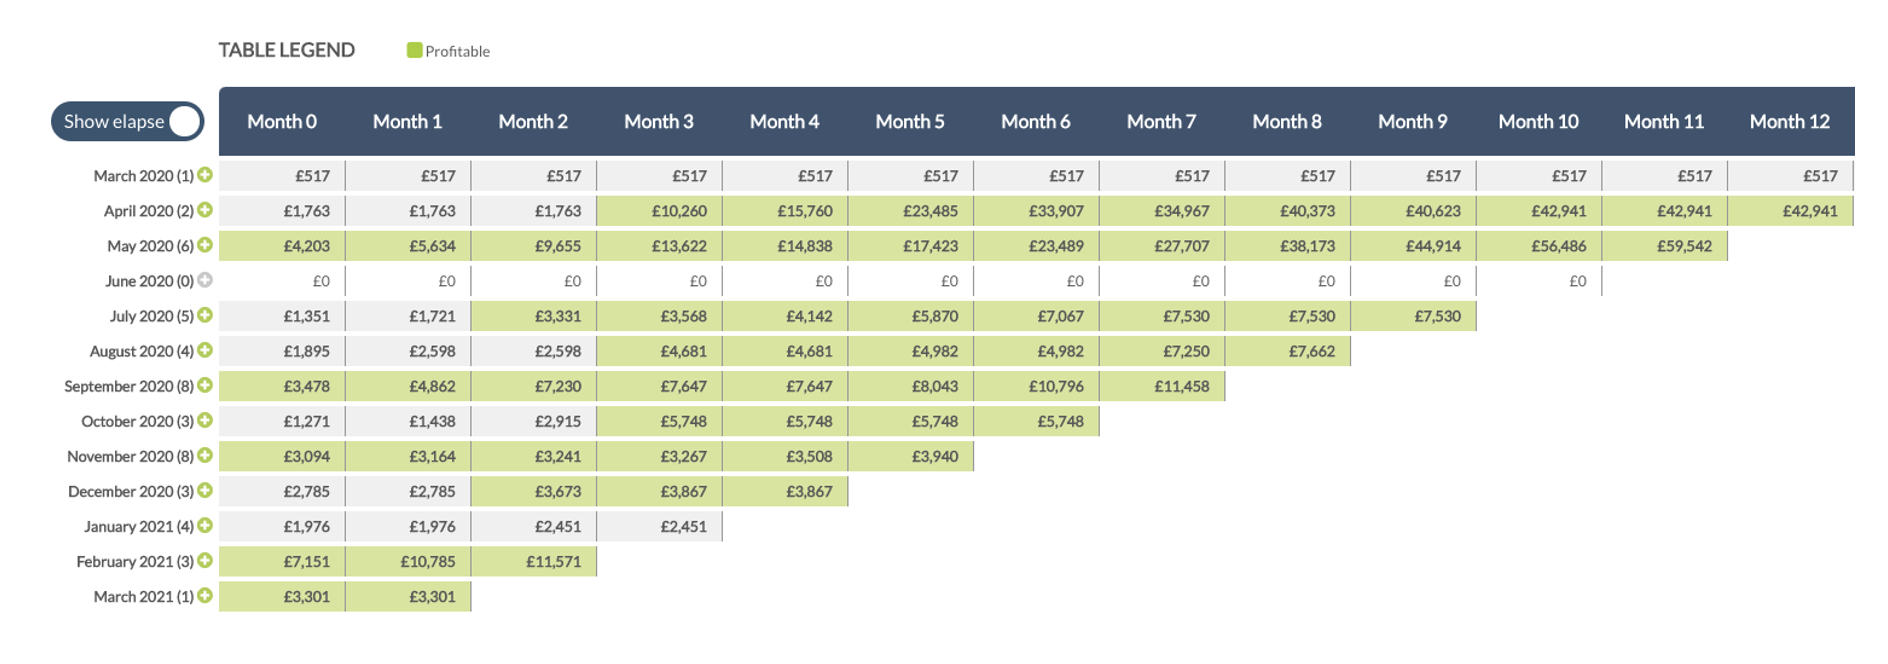
Cumulative revenue
Cumulative revenue cohort analysis shows the length of time to ‘repay’ the cost of acquiring a new customer, which in the example below is £3500.
The green boxes highlight that most cohorts repay by month 3, which is very positive. A payback period of less than six months, combined with low churn, is an indication that a company is ready to accelerate their growth.
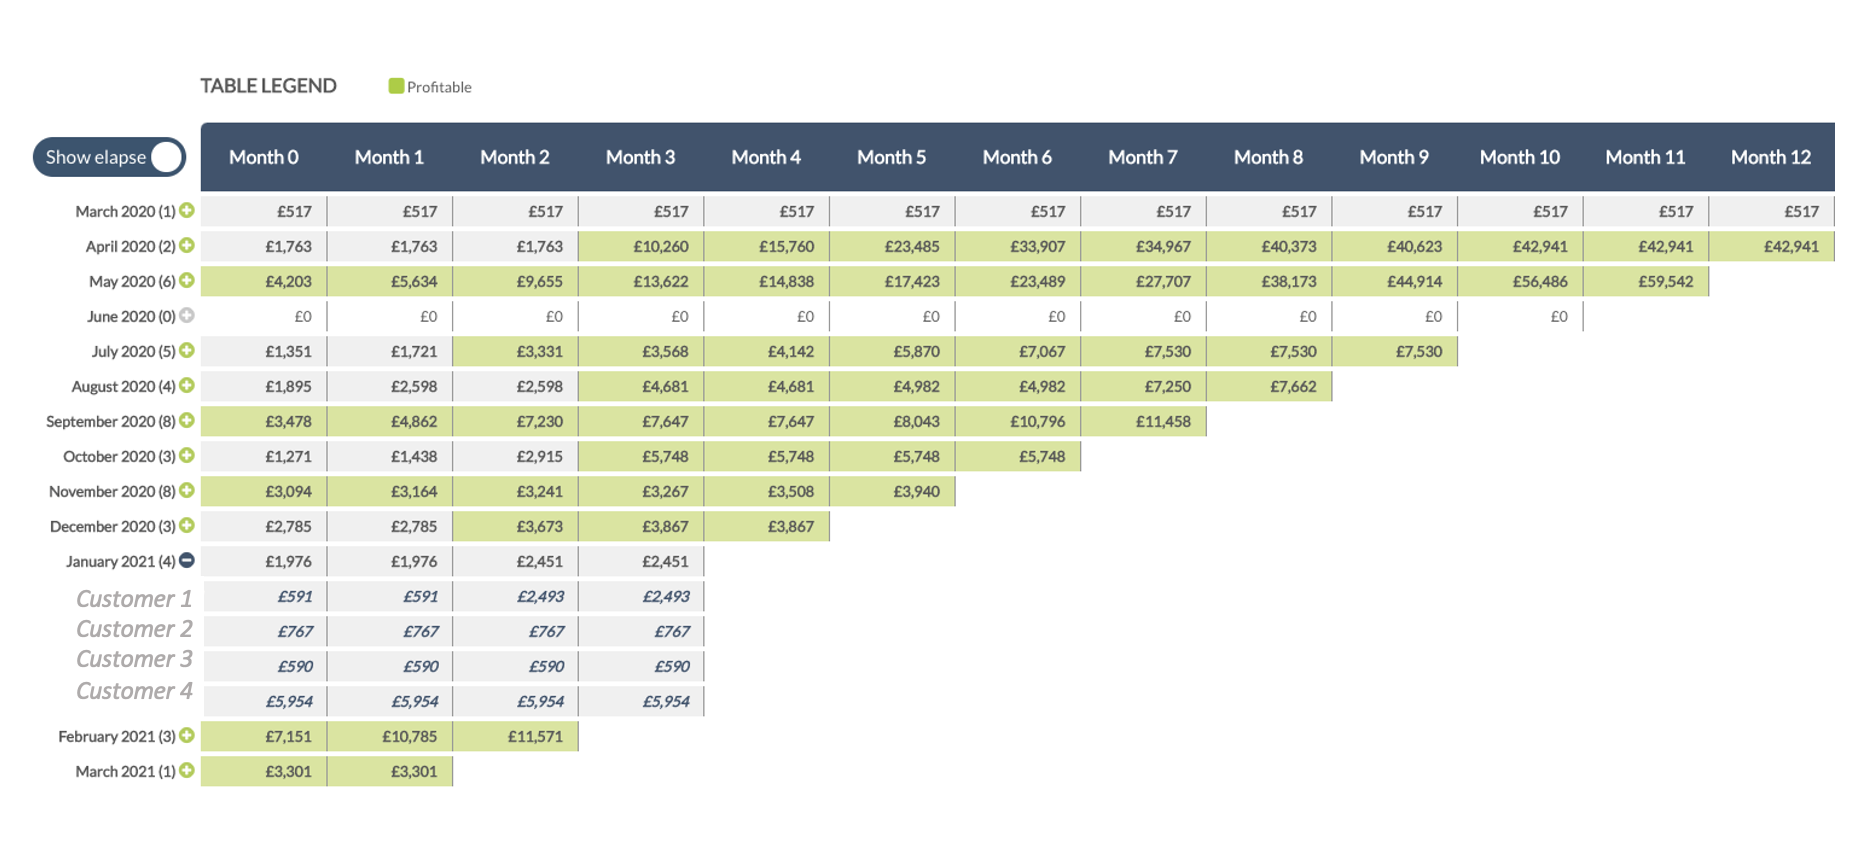
Continuing with this example, we can see that the customers acquired in January 2021 have not yet hit the payback threshold. A simple click reveals the names of these customers, allowing the company to swiftly identify any issues and take action.
Typically, cohort analysis requires hours to build in a spreadsheet. At ScaleXP, we have fully automated the process, making it easier and quicker for companies to understand their customers’ buying behaviour. Time can be spent on designing actions to improve the business rather than compiling data.
At ScaleXP, our mission is to make the accessing and understanding of your data a quick & simple routine which can make a profound difference between ultimate success and failure. Our platform lets our clients take corrective actions, knowing that the system will measure their impact.
If you are interested in learning more, feel free to book a free demo here.


