
For the latest SaaS Benchmarks click here.
This is the first of six articles on the latest SaaS Benchmarks, providing a global view with insights from USA, Europe and UK. This article specifically focuses on revenue growth, THE single most important SaaS metric.
Before we launch into a slew of numbers and data, here are a few reasons why they are relevant to all investor funded SaaS companies:
In 2022, there was a seismic shift in the valuation of tech companies, both public and private. Amazon stock, for example, fell a whopping 52%, marking the biggest decline since 2000 and the dot com era. Meta (Facebook’s parent company) fell 66% and Tesla was down 68%. 2022 was a brutal year for mega tech companies, and this has reverberated throughout the market.
2023 is looking no better. As of March 2023, Amazon stock has yet to recover even 10% of its value. And then there’s the collapse of Silicon Valley Bank and ongoing economic uncertainty around interest rates…
You will see later in this article that leaders of SaaS businesses need to deliver a 50%+ revenue growth rate to secure future funding at any reasonable valuation. Metrics which were previously ‘nice’ are now crucial indicators of smart growth, critical for funding success.
Companies in the lowest quartile of performance are struggling to access funding, and even the top performers are only achieving flat valuations.
This article is designed to provide a solid understanding of Revenue Growth Rate expectations for companies of your size. It will answer these questions:
- What is revenue or MRR growth?
- How is it calculated?
- What is the average growth rate for SaaS companies of your size?
- What is best in class for companies of your size?
- Is there any difference in performance between US and European companies?
- What steps can you take to improve revenue growth?
If you are looking for data on other SaaS benchmarks, you can see them all in our benchmark series page here: The full SaaS benchmarks series.
What is revenue growth rate?
How do you calculate revenue growth rate?

What is the gold standard for SAAS growth?
For years, the gold standard benchmark for SaaS growth has been the Mendoza Line for Growth, developed by Scale Venture Partners, a California-based VC and early investor in Box, DocuSign, and others.
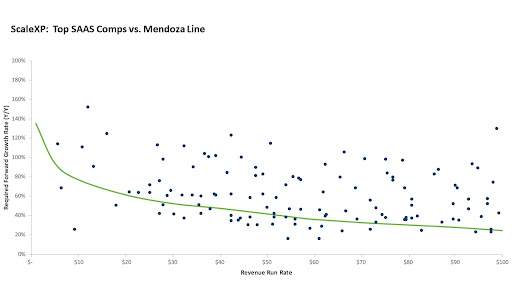
SaaS Revenue Growth: Best in Class Benchmarks
| Current ARR | $1M | $5M | $10M | $20M | $40M | $60M | $80M | $100M |
|---|---|---|---|---|---|---|---|---|
| Mendoza Line Growth Rate | 140% | 94% | 77% | 62% | 46% | 36% | 30% | 25% |
What are the 2022 global benchmarks?
2022 SaaS Revenue Growth Benchmarks
| Annual revenue | 2019 | 2020 | 2021 | 2022 |
|---|---|---|---|---|
| Less than £1M | 80% (15-125%) |
100% (12-177%) |
100% (26-300%) |
100% (46-286%) |
| £1M - £2.5M | 80% (30-165%) |
60% (31-100%) |
90% (45-300%) |
79% (37-153%) |
| £2.5 - £10M | 50% (30-100%) |
41% (22-84%) |
50% (30-100%) |
50% (30-115%) |
| £10M - £20M | 42% (22-78%) |
46% (25-71%) |
50% (20-75%) |
72% (30-101%) |
| £20M- £50M | 40% (20-61%) |
50% (18-75%) |
35% (25-49%) |
40% (30-52%) |
| More than £50M | 29% (10-40%) |
21% (14-40%) |
30% (10-56%) |
30% (18-55%) |
What about European SaaS benchmarks?
2022 European SaaS Revenue Growth Benchmarks
| Annual revenue | 2020 | 2021 |
|---|---|---|
| Less than €1M | 150% (50-260%) |
170% (0-380%) |
| €1M - €5M | 90% (50-160%) |
66% (15-100%) |
| €5M - €10M | 65% (50-130%) |
32% (15-50%) |
| More than €10M | 60% (40-60%) |
37% (40-50%) |
What can do to improve revenue growth?
The European benchmarks suggest that companies with less than €1M in annual revenue grow faster than their American counterparts. In Europe, the growth rate is 170%, whereas in the USA, it’s 100%. However, these growth rates equalize around €5M of revenue. Beyond this threshold, the growth rate of European companies slows down, and American companies begin to outpace them.
The findings for early-stage European companies (those with less than €10M in revenue) surprised researchers. This could be due to the small sample size, as only 46 companies with revenue less than €1M and 69 companies with revenue between €1-5M were included in the study.
Our first and most critical piece of advice is to look at your numbers every month. At the very minimum, you should be monitoring revenue growth, CAC payback, net dollar retention, rule of 40 and cash burn. This data should be automated because your time is better spent on driving growth rather than tedious calculations.
- Faster new customer acquisition
- Lower churn from existing customers
- Price increases or upsells
What can I expect in 2023?
To recap:
Our expectations for 2023 include:
- An increase in average MRR growth rates across the board compared to 2022.
- Turbulent funding markets, making valuation increases challenging.
- Struggles for the lowest quartile of companies in securing funding.
- Keep a careful eye on their key metrics.
- Invest in platforms like ScaleXP to closely monitor valuation metrics and drive informed decision-making.
Conclusion
ScaleXP provides SaaS companies with a market-leading, fully automated view of all their key metrics, including those most vital to investors in 2023. By connecting with both your accounting data and your CRM platform, our solution empowers you to track benchmarks and measure performance with unparalleled ease.
If you’re ready to take your metrics tracking and benchmarking to new heights, click here to get started with ScaleXP. Enhance your company’s data-driven decision-making and stay at the forefront of the curve with ScaleXP.


Subscribe to our newsletter
If you found this article or any other article on our website helpful, you can join our monthly newsletter where we will be sharing all of our new reports exclusively with you.
