

See how ScaleXP works with Xero or QuickBooks.
In a 30-minute demo, we’ll show the relevant workflows using example data and discuss how they could apply to your finance process. Complex requirements? Discuss them with us first.
Unit economics for SaaS: how to calculate LTV, CAC and revenue per customer, the 3:1 LTV to CAC rule of thumb, and what investors look for.
Unit economics measure revenue and cost per customer. For SaaS investors, three matter most: customer lifetime value (LTV), customer acquisition cost (CAC) and revenue per customer, with LTV of at least three times CAC the usual rule of thumb. ScaleXP calculates all three each month from your accounting and CRM data.
SaaS companies which track their data and metrics are consistently more successful in the long term. Investors know this, since it feeds valuation multiples for SaaS companies, but are frustrated by investee data awareness and reporting.
To quote Smedvig Capital, “An important part of our evaluation of a company is digging into their financials and economics. However, we often find there is very little consistency in how financial data, cohorts, and metrics are recorded and tracked, and in how companies use these to forecast growth.”
A critical component that brings order and understanding to data analysis is “unit economics”. Unit economics refers to direct revenue and cost, measured per unit. For SaaS companies, the most common unit is per customer.
Unit economics are critical to understanding and forecasting future growth and profitability. While there are many measures of unit economics, three dominate:
(commonly abbreviated CLTV, LTV or CLV) is a measure of how much money you will make from a customer over their life, or the time that they are your customer.
For early-stage companies, particularly pre-seed or seed stage companies, measuring margin over the actual life of a customer can be tricky as they may buy from you for years into the future, making it hard to assess their ‘lifetime’, today.
To address this issue, our preferred formula for Lifetime value is based on the average margin per customer divided by average churn.
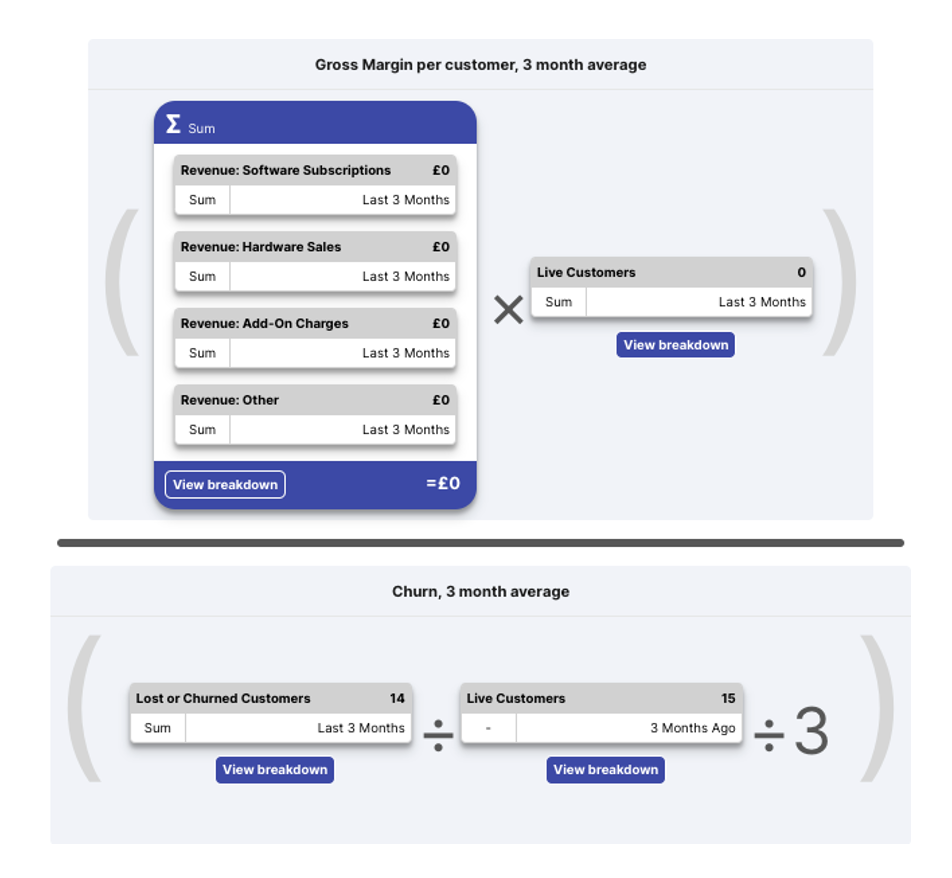
This formula is particularly useful for venture funded companies because it:
Seeing this data regularly using automation helps ensure an ongoing focus on improvement.
Quick question
What’s most frustrating about reporting your SaaS metrics?
Choose as many as apply.
Please don’t include personal information. We read every answer.
Considering automating your SaaS metrics?
See it in a 30-minute demo.
Reporting-time estimator
How long does it take you to report your SaaS metrics each month?
Your accounting system
How long do your metrics and board reporting take today? Working days per month, roughly
Which of these do you still build by hand? Select all that apply
Which of these takes the most time? Pick one
Your estimate
Board pack ready in about 1 day instead of 2–3 days
ScaleXP calculates the metrics you selected from your live Xero and CRM data, reconciled to the accounts, and places them in a board pack your team reviews rather than builds.
(commonly abbreviated CAC) is a measure of how much it costs to acquire a new customer. It should include all marketing and sales costs, including salaries.
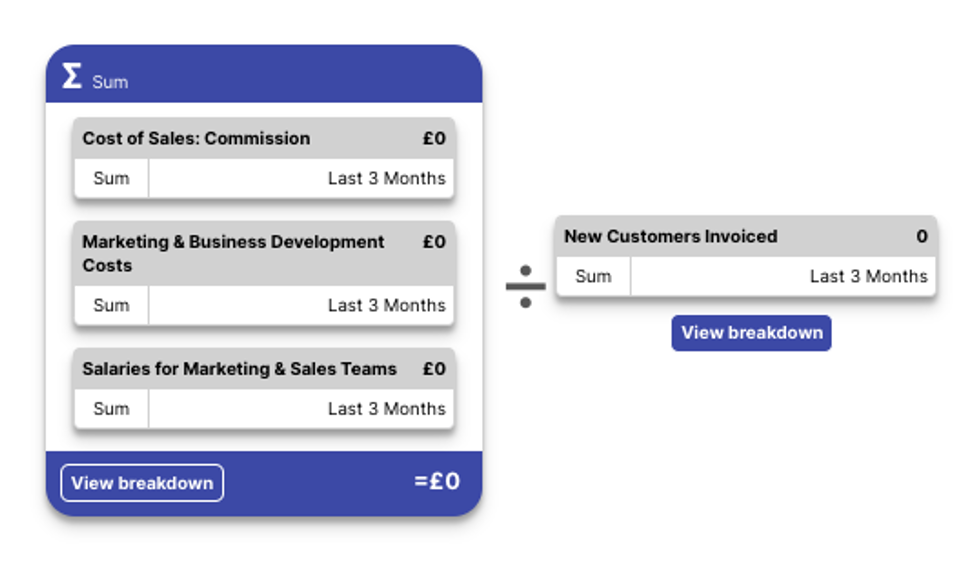
As companies grow, CAC usually falls because more customers are acquired over time as businesses gain traction.
The most common question that we are asked is,
CAC varies widely by company. For some SaaS companies, it can be as low as a few pounds. For others, it can be £500,000+. The amount does not matter. The relationship to LTV is critical.
If a company spends £1000 to acquire each new customer, LTV should be £3000, ideally more.
And, in case you want to see just how wide the gap between LTV and CAC can grow, here is a great snapshot from one of our current customers. An LTV:CAC ratio of 50 is truly impressive!
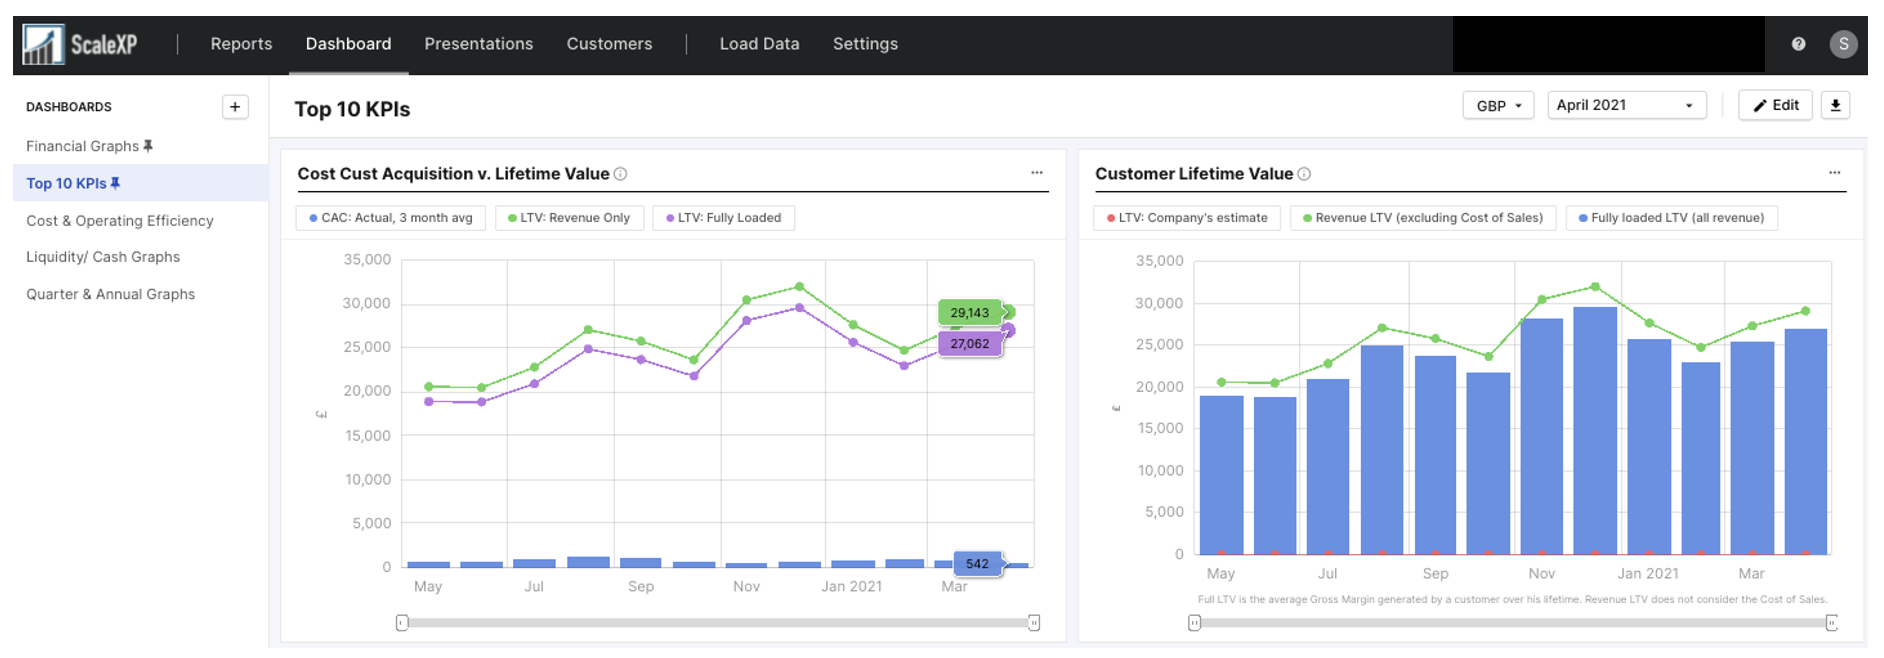
The ratio of LTV: CAC can shift quickly as a company finds product market fit and starts to gain traction. LTV will increase as customers spend more and churn less. CAC can simultaneously fall through more efficient marketing. As the gap between LTV and CAC widens, it is a greater indicator and perhaps the best indicator that the company is ready to accelerate.
While Lifetime Value and Customer Acquisition Costs are the most important metrics for unit economics, we like to balance this with a third, which is a simple measure of revenue per customer.
Spend per customer is increasing, and ideally the number of customers at the same time.
All B2B companies, no matter their stage of growth, can benefit by measuring unit economics regularly. Collating data across teams, however, can be tricky and time-consuming. The good news is that ScaleXP can make your life just a lot easier.
Our objective at ScaleXP is to ensure our clients have an environment where every company has actionable data insights in real time. Our system will provide CAC, LTV, revenue per customer each month using data in your underlying systems (Xero, HubSpot, Salesforce, etc), allowing you to access the data each month without even building a spreadsheet. And CAC and LTV are just the tip of the iceberg.
Investors look at SaaS unit economics such as customer lifetime value, customer acquisition cost, the LTV to CAC ratio, CAC payback and revenue per active customer, with LTV of at least three times CAC a widely used rule of thumb. ScaleXP calculates these unit economics automatically from Xero, QuickBooks Online or Zoho Books and HubSpot, Salesforce or Pipedrive data, so founders have current figures on hand. Trends sit in live dashboards and board packs. Finance teams impress investors with consistent, reconciled unit economics instead of one-off spreadsheet calculations.
Yes, ScaleXP calculates LTV and CAC automatically, using revenue and gross margin from Xero, QuickBooks Online or Zoho Books and customer data from HubSpot, Salesforce or Pipedrive. LTV reflects gross margin per customer and churn, while CAC brings together sales and marketing costs, including salaries, recorded in the accounts. Because inputs come straight from the ledger, the LTV to CAC ratio stays consistent with the financial statements every month. Hannah, Cofounder, said: “ScaleXP has replaced our manual spreadsheets and tracking with clean, automated SaaS reporting.” Investors see unit economics they can trust.
ScaleXP tracks unit economics trends over time by recalculating LTV, CAC, CAC payback and revenue per active customer every month from connected accounting and CRM data. Cohort analysis shows how quickly each customer group repays acquisition cost and whether the gap between LTV and CAC is widening. Live dashboards and the AI report builder present those trends clearly, with drill-down to the underlying customers. Founders show investors improving unit economics backed by data, a strong signal of product-market fit and readiness to scale.
ScaleXP gives CFOs board-ready unit economics in PowerPoint board packs, live dashboards and presentation mode, all fed by automated calculations from Xero, QuickBooks Online or Zoho Books and HubSpot, Salesforce or Pipedrive. LTV, CAC, CAC payback and the LTV to CAC ratio appear alongside ARR, NRR, churn and management accounts, so the board sees how acquisition efficiency connects to overall performance. Directors can drill down from any metric to the data behind it during the meeting. CFOs spend less time assembling packs and more time explaining what the numbers mean.
How ScaleXP does this
ScaleXP calculates MRR, ARR, churn, retention and more from your CRM and accounting data, with no spreadsheets. See ScaleXP’s SaaS metrics