Ready to transform data to insight?
Getting started with ScaleXP is easy! Try it for yourself free for 7 days. Or, if you have specific questions, just use the button to the right to schedule a quick meeting.

Revenue Retention measures the percentage of revenue that a company retains from its existing customers over a given period of time.
Gross Revenue Retention includes the impact of downgrades and lost MRR. Net Revenue Retention includes the impact of downgrades and lost MRR as well as the impact of upsells or expansions. Net Revenue Retention can also be called Net Dollar Retention. Net Revenue Retention and Net Dollar Retention are synonymous.
Both revenue retention and growth revenue retention can be tracked on ScaleXP. Come and see for yourself with a 7-day trial.
Gross Revenue Retention is calculated as:

Net Revenue Retention or Net Dollar Retention is calculated as:

The formulas above show Gross and Net Revenue Retention calculated on an annual basis. The same formula can be used for any time period.
Benchmarks are typically calculated using annual Gross Revenue Retention and annual Net Revenue Retention.
To convert from a shorter period to an annual one, take the retention rate for the period to the power of the number of periods in a year. For example, if a company’s retention rate for one quarter is 92%, then the annualised retention rate for the year would be 0.92 to the power of four (that is, 0.92×0.92×0.92×0.92), or 0.72 = 72%.
Both Gross and Net Revenue Retention are measured as a %.
The only difference between the two formulas is that Net Revenue Retention includes the impact of upsells or expansions. This may seem trivial, but for companies with a strong ‘land and expand’ model, the impact is profound.
Gross Revenue Retention has a maximum value of 100%, if there are no losses or downgrades. Net Revenue Retention can be higher than 100%, due to upsells. As an example:
For both Gross Revenue Retention and Net Revenue Retention, a higher number is a better result.
Gross and Net Revenue Retention can vary widely depending on the nature of the business and the specific group of customers being analysed. In the first instance, it’s important to compare results internally, assessing trends over the last several months or quarters.
Both Gross Revenue Retention and Net Revenue Retention should increase over time, ideally moving towards 100%. Low or falling results can indicate that the business is losing customers or failing to upsell and cross-sell to its existing customers.
SaaS (Software as a Service) companies use Gross Revenue Retention as a key metric to assess the stickiness of the product. A high Gross Revenue Retention rate indicates that a significant portion of the company’s revenue is retained, which is positive.
Gross Revenue Retention (GRR) and its link to churn directly impact the financial health of a SaaS company. GRR measures the percentage of recurring revenue retained from existing customers before any upsells or expansions. A declining GRR signals customer churn – customers canceling their subscriptions or downgrading to lower-priced plans. Churn is the silent killer of SaaS businesses; it erodes the foundation of your revenue stream. A strong GRR, on the other hand, indicates a healthy customer base with high levels of satisfaction and loyalty. This not only stabilizes revenue but creates a solid platform for future growth.
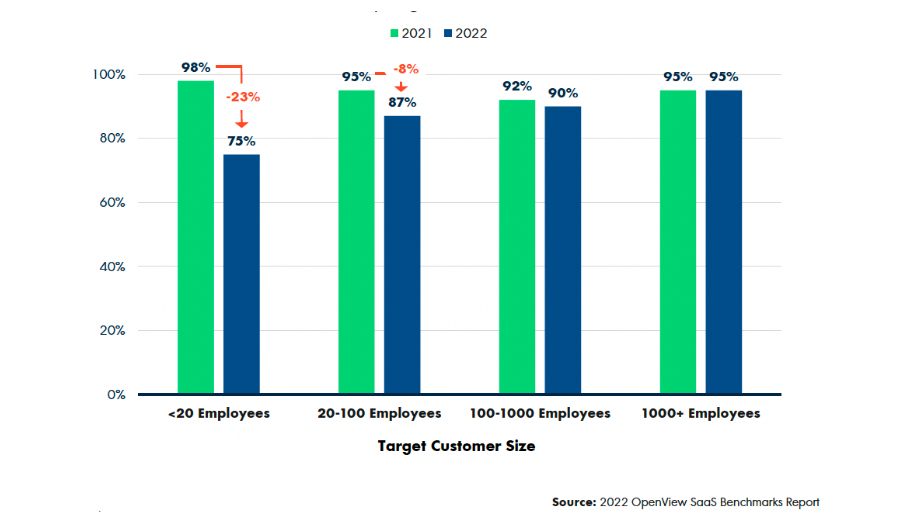
To be more meaningful, benchmarks for Gross Revenue Retention and Net Revenue Retention need to be based on the size of your customers as well as the size of your own business.
In 2022, many SaaS companies have seen a drop in their Gross Revenue Retention. SaaS companies that sell to smaller companies, those with less than 20 employees, have been hit the hardest, with Gross Revenue Retention falling from 98% in 2021 to 75% in 2022, a drop of a whopping 23%.
In contrast, SaaS companies that sell to corporations, those with less than 1000+ employees, have seen no change in Gross Revenue Retention.
The causes for this difference are likely to be:
The lifting of COVID-19 restrictions may have also had an impact, although it is unclear why this would disproportionately impact smaller companies.
Full results are shown in the graph below.
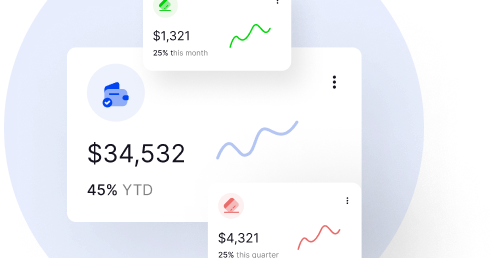
ScaleXP fully automates Net Dollar Retention. Through a series of smart algorithms, the system will classify your revenue into New, Lost, Upsells, and Downgrades. These algorithms make it easy to fully automate both revenue recognition and critical SaaS metrics.
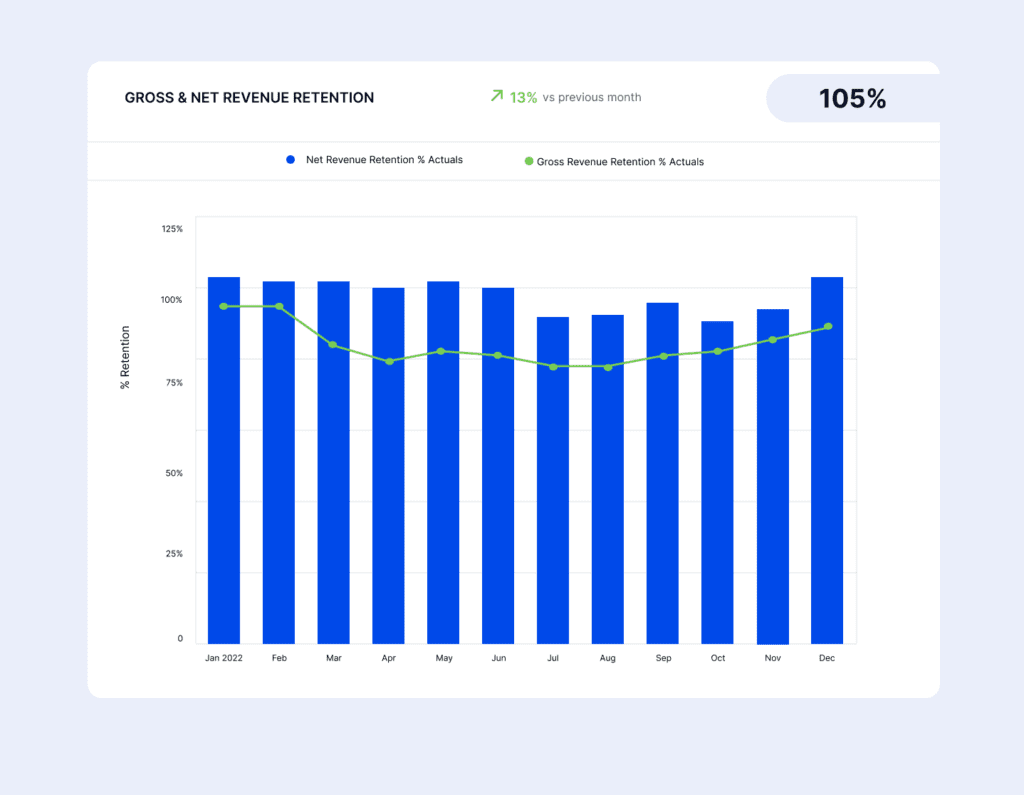
This graph shows Net Revenue Retention calculated as a single month, six-month average and compared to a budget or target. Comparing Net Revenue Retention using different time periods is the best way to understand and spot trends. In this graph, the six-month retention rate is lower than the current month. This is positive and indicates that the company has improved retention. Companies with less than $20M revenue can have a significant impact on retention and churn quickly. Continuously monitoring metrics reflecting different time periods makes it easy to track progress and spot problems.
ScaleXP fully automates all standard SaaS KPIs. Through a series of smart algorithms, the system will classify your revenue into New, Lost, Upsells, and Downgrades. These algorithms make it easy to fully automate both revenue recognition and critical KPIs, including both Gross Revenue Retention and Net Revenue Retention. These metrics are available continuously via online dashboards, making it easier to track and share results without waiting for spreadsheets to be updated. Click here to read more.
Predictable revenue that a company can expect to receive on an annual basis from its subscription-based products or services.

Percentage increase in MRR over a certain period of time, most typically a quarter or a year.

Customer churn is the percentage of customers who stop doing business with a company or using a service.
Connect and combine data from a wide range of accounting & sales CRM systems. Use integrated data to create a comprehensive, fully automated suite of SaaS metrics.
Click below to understand if ScaleXP connects to your systems.
Getting started with ScaleXP is easy! Try it for yourself free for 7 days. Or, if you have specific questions, just use the button to the right to schedule a quick meeting.