For a 2024 view of all SaaS Benchmarks click here.
Click here for the 2024 article on CAC and CAC Payback benchmarks for 2023.
This article covers 2022 benchmarks.
In this article, we provide the latest SaaS benchmarks for customer acquisition costs and CAC Payback, broken down by both company size and type of customer.
The article will answer these questions:
- What is Customer Acquisition Cost, and what is CAC Payback?
- How are Customer Acquisition Costs and CAC Payback calculated?
- What are the latest benchmarks?
- How do these benchmarks vary by company size?
- Are there differences in the benchmarks between US and European companies?
What is CAC Payback and Why Does it Matter?
Customer Acquisition Cost, abbreviated CAC or CCA, is the amount spent to acquire a new customer. CAC Payback is the length of time (in months) for the company to recoup the acquisition cost.
CAC and CAC Payback are two critical and complementary metrics for growth companies as they speak to the pace at which a company can grow and the cash that it will require to meet its growth targets.
How to Calculate CAC & CAC Payback (with Examples)
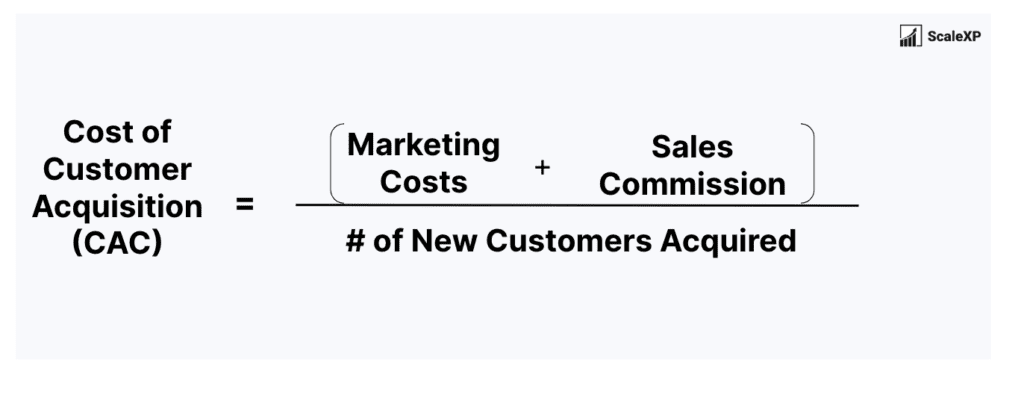
Acquisition cost is the average cost to acquire one new customer and includes the following costs:
- Marketing and advertising
- Business development
- Salaries for the sales and marketing teams
- Sales commission and sales incentive schemes
- Any other costs incurred specifically to acquire new customers
These costs are divided by the number of new customers, resulting in the average cost to acquire a single new customer.
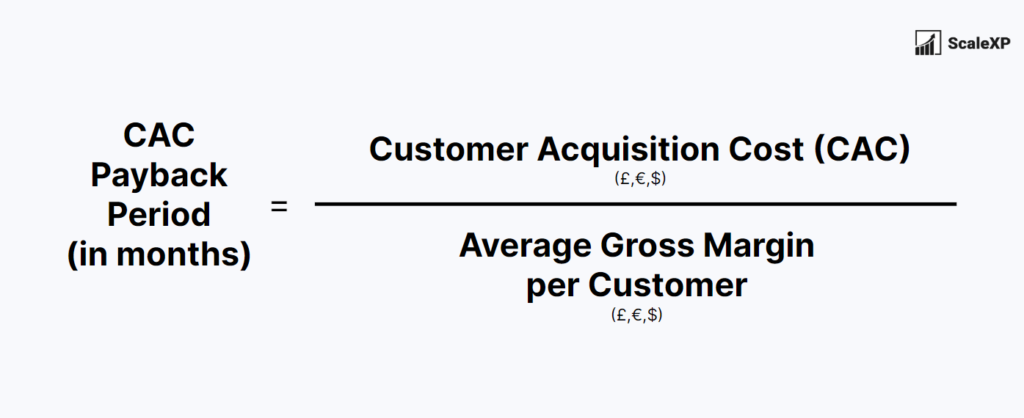
To calculate CAC Payback, simply divide CAC by the average Gross Margin per customer, as shown below. The result will be the number of months required to recoup acquisition costs.
CAC Payback Benchmarks by Company Size
CAC can be quite difficult to compare across companies because acquisition costs vary dramatically based on the ticket size of the software. For this reason, CAC Payback is used for benchmarking.
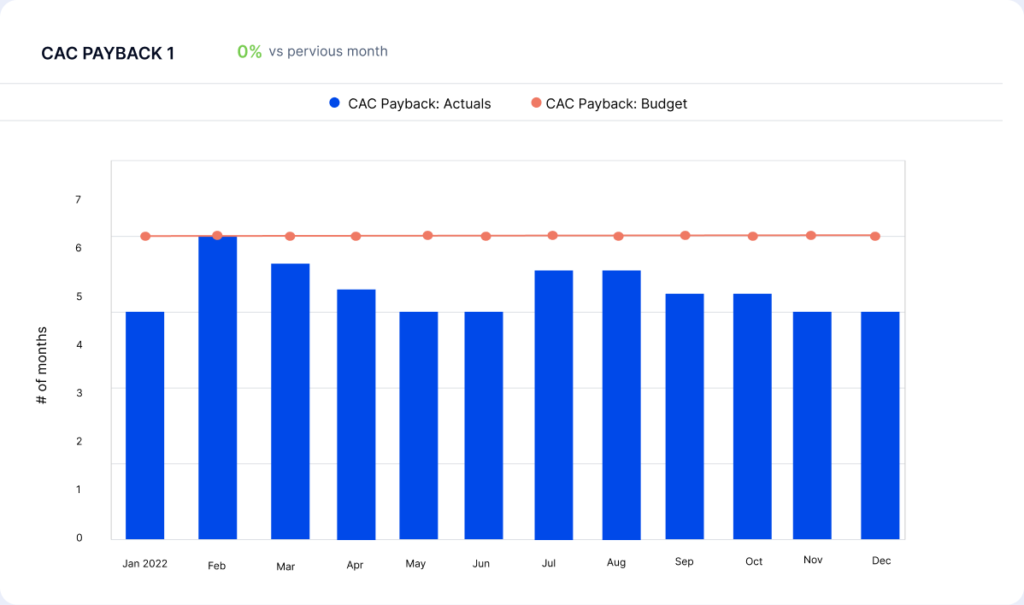
This table shows CAC Payback by company size or annual revenue. To read the table, just find the size of your business and read down the column. The number represents the number of months to recoup acquisition costs. Payback periods have remained relatively flat over the past three years.
| Target Customer Type | No. of Employees | Good CAC Payback (50th Percentile) | Great CAC Payback (80th Percentile) |
|---|---|---|---|
| VSMB/Prosumer | <20 | 9 months | 2 months |
| SMB | 20-100 | 7 months | 4 months |
| Midmarket | 101-1,000 | 14 months | 7 months |
| Enterprise | 1,000+ | 14 months | 9 months |
How do these benchmarks vary by the size of the target customer?
CAC Payback varies significant by the size of your customers. The cost of acquiring a customer that will bring in $1M is very different to a customer that generates $100.
- The table below shows data for:
Very small SMEs, those with less than 20 employees - SMEs, with between 20 and 100 employees
- Mid-size companies with between 101 and 1000 employees
- Enterprise companies with over 1000 employees
CAC Payback (months)
| <$1m' | $1-2.5m | $2.5m-10m | $10-20m | $20m-50m | >$50m | |
|---|---|---|---|---|---|---|
| 2020 | 8 | 10 | 11 | 11 | 15 | 15 |
| 2021 | 8 | 8 | 15 | 15 | 18 | 15 |
| 2022 | 7 | 11 | 12 | 15 | 17 | 16 |
Source: Openview 2022 SaaS Benchmarks
So if you are selling to SMEs, with between 20 and 100 employees, you should target a CAC Payback of 7 months. A lower number is even better, with the best performing SaaS companies achieving a 4 month payback.
US vs. European CAC Payback: Key Differences
European benchmarks show lower CAC Payback for at the early stages.. Around $10M or €10M, CAC Payback periods equalise with European and international companies achieving similar levels of performance. So European companies are slight more efficient in the early days but then move to international standards.
That being said, regardless of the differences in benchmark, according to a report by David Skok, a venture capitalist and entrepreneur, the ideal period should be less than 12 months for all SaaS companies.
Strategies to Improve Your SaaS CAC Payback
There are three ways to have a material impact on your CAC Payback:
Optimise Your Gross Margin
- Companies with the best CAC Payback period have higher Gross Margins. Review your Cost of Sales or Direct Costs to determine if you can trim costs. Hosting costs, which is typically the largest component of Cost of Sales, can be drive lower by looking for start-up or scaleup offers. AWS has generous incentives for start-ups and Google has launched some offers as well
Refine Your Marketing Spend
- Focus on efficient growth, rather than growth at any costs. Tie sales incentives to results and negotiate agreements with marketing agencies. 2023 is the year of efficient growth, so you will be in good company.
Reduce Customer Churn
- McKinsey & Company found that SaaS companies with a lower ratio of CAC to Customer Lifetime Value (LTV) tend to have higher valuations. Top-quartile SaaS companies have an LTV to CAC ratio of more than 5x, while bottom-quartile companies have a ratio below 3x.
What Can we Expect Next?
2023 is seeing huge (downward) shifts in valuation and in spend. Many financed teams are reviewing spend with the objective of conserving cash.
Our prediction for 2023 is that CAC Payback will fall compared to 2022, with the lowest quartile of SaaS companies will struggle to raise funding. The best performing companies will spend judiscally and focus on smart growth. Both factors will contribute to better CAC payback periods.
Conclusion
At ScaleXP, we are passionate about using data to understand and improve performance. We have fully automated all SaaS metrics, from CAC Payback to ARR to Rule of 40. By connecting with, and importing data from both your accounting and sales or CRM systems, the ScaleXP platform creates a single source of truth for your SaaS data. To check if we integrate with your systems, just click here.
To read more about how we can automate your SaaS metrics, click here.


