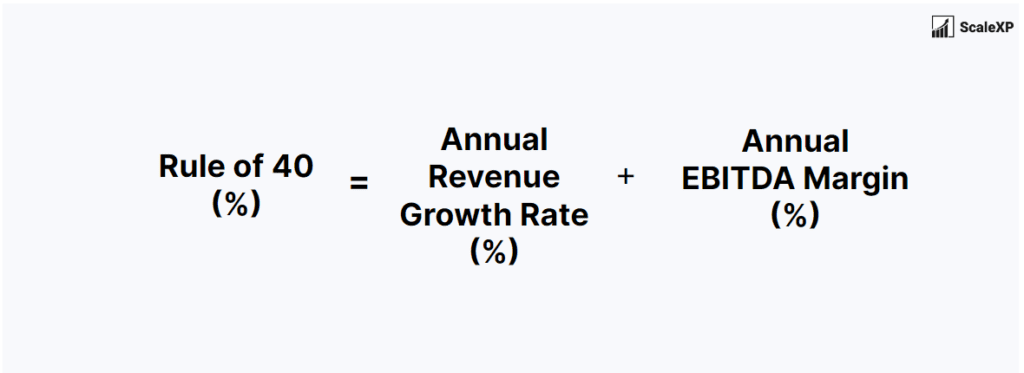
How is Rule of 40 used by SaaS companies?
Rule of 40 is commonly used for benchmarking performance. Some investors and analysts also use the Rule of 40 as a factor in valuing companies.
One indication of the Rule of 40’s adoption is the frequency with which it appears in the financial press and industry analysis. For example, Bessemer Venture Partners, a prominent venture capital firm that invests in SaaS companies, has discussed the Rule of 40 in their annual “State of the Cloud” reports.
Understanding Recurring Revenue in Rule of 40
Finance teams and CFOs often question whether the ‘Annual Revenue Growth Rate’ should be calculated as recurring revenue or total revenue. The choice can be complex, but ultimately comes down to the importance of non-recurring or one-off revenue. When it’s a small percentage of the total, it is typically excluded, whereas if it’s a core part of the offering, it’s included. If you’re still unsure, just track Rule of 40 using both definitions. Monitoring these over time frequently leads to additional insights and clarity as to which option is best.
What is a good result?
With Rule of 40, the higher the number, the more favourable the result. This being said, there’s huge variability in top quartile results by company size.
What are the Saas Rule of 40 benchmarks?
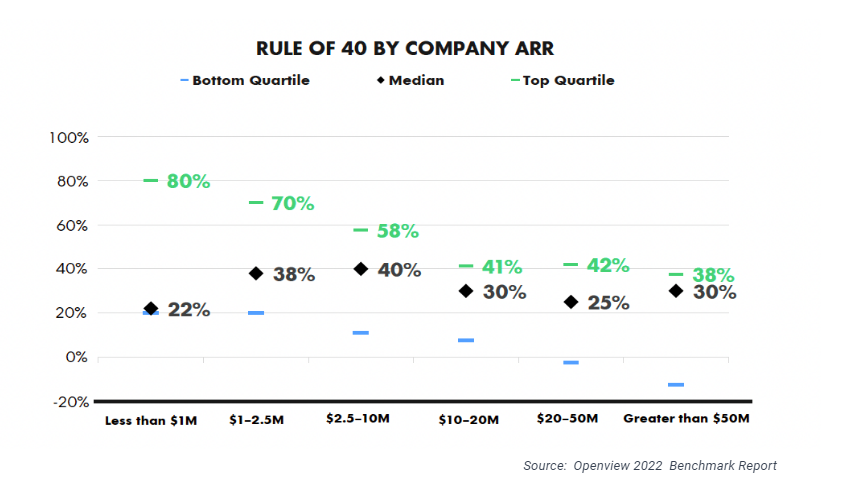
The Rule of 40 metric is widely benchmarked, with the latest 2023 results below.
To read the benchmarks, just find the size of your business on the horizontal axis then review the median, top quartile and bottom quartile results.
As an example, for companies with less than $1M of ARR, median Rule of 40 scores were 22%, but top quartile performance was nearly 4x this amount at 80. For companies with greater than $50M in revenue, the 2022 median score was 30% while the top quartile was 38%.
The most astounding conclusion is that the median result is consistently below 40 for companies of all sizes except $2.5 – $10M, while top quartile performance is consistently above 40.
This benchmark data was compiled by OpenView in the largest 2022 benchmark report, which includes over 600 companies located across the globe.
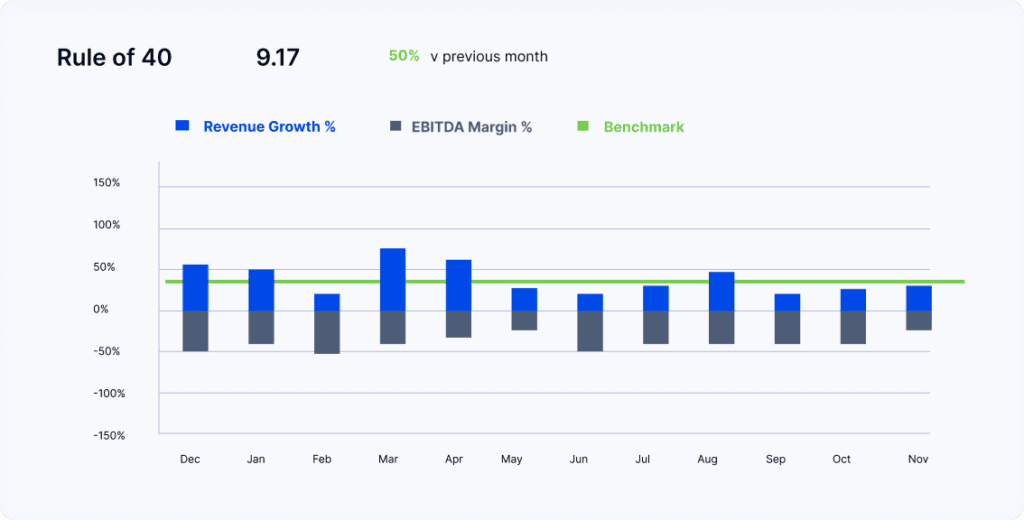
SaaS Rule of 40 Visualisation Example
ScaleXP automates Rule of 40 calculations. Through integrations with both your accounting and CRM systems, as well as a smart set of text recognition algorithms, the system provides a fully automated view of all metrics. Graphs, such as the one shown, are interactive, allowing you to easily see detailed data in a few clicks.
However the “Rule of 40” is just one of several important metrics automated by the ScaleXP platform. To read more about how the system can automate all your SaaS metrics, click here. Or, if you would like to dive right in and take a look for yourself, you can start a free 7-day trial here.
Level up your SaaS metrics – book a free demo today
If you found this metric guide or any of our other SaaS metric pages helpful, we invite you to book a free demo of our platform and take your business to the next level.