Ready to transform data to insight?
Getting started with ScaleXP is easy! Try it for yourself with a 7 day free trial and get set up in minutes. Or, if you’d like to take a deeper dive, book a demo at a time that suits you.
Sales Efficiency measures how efficiently a company converts its sales and marketing investments into new revenue.
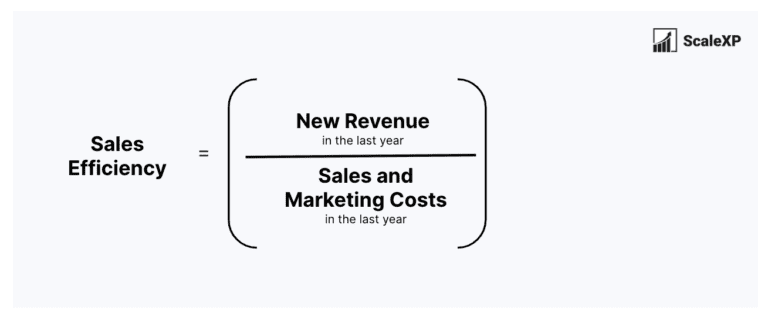
Sales Efficiency is the amount of new revenue generated during the period divided by the sales and marketing expenditure for that same period.

As an example, if in a given year, sales increase from $10m to $15m while sales and marketing spend is $8m, the ratio would be ($15m – $10m)/$8m resulting in $0.63 in new revenue for every $1 in S&M spend. Many people think of the ratio output as a % but it is actually a number which indicates the amount of new revenue for every $1 of sales and marketing investment.
In calculating Sales Efficiency, it is important to consider the sales and marketing costs to include. Traditionally, all costs are included: advertising, business development, sales salaries and commission.
Sales Efficiency is used as a part of a broader suite of KPIs, typically for companies with sales teams. A higher Sales Efficiency ratio indicates that a company is generating more revenue relative to its sales cost. This is positive and indicates that the company has an efficient sales process.
Tracking Sales Efficiency over time is critical and provides useful guidance on the optimal level of spend. If sales spend increases and the Sales Efficiency ratio also increases, this is positive. Alternatively, if the ratio falls as spend rises, the additional cost may need to be reviewed.
Sales Efficiency varies widely by company size, circumstances and industry. Blossom Street Ventures, a VC in the USA, found SaaS companies with successful IPOs had an average sales efficiency of 99% and median efficiency of 67% in the year before going public.
To quote the VC partner at Blossom Street Ventures, “If every dollar of sales and marketing spend yields $0.67 of new revenue or better yet ARR, so long as you’re retaining that ARR every year and growing it (Net dollar retention is over 100%), the sales and marketing function is working well. Assuming 100% net dollar retention, your payback period is 1.5 years, which is a great return on any investment where you keep a customer forever.”
Try as we might, we could not find credible Sales Efficiency benchmarks across a broad range of companies by size. The best general market data is from companies in the years before IPO (as quoted above). If this guidance is not useful, say because you are too far before IPO and you still want benchmarking data, a close alternative is CAC Payback, and you can find all the latest CAC Payback benchmark data in this article.
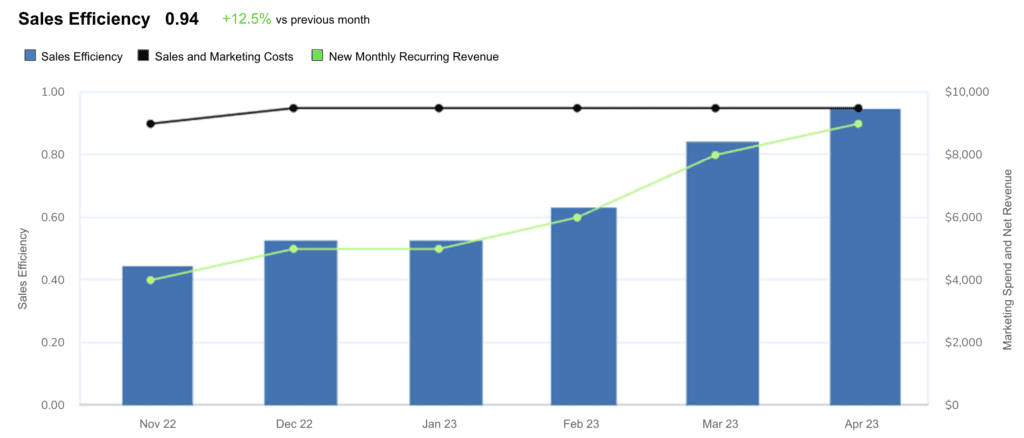
ScaleXP fully automates Sales Efficiency. Data is compiled automatically from your accounting or financial system. Your internal budgets, targets, and forecasts are automatically added to the graphs. All you need to do is click to share the insights with your team. Click here to learn more.


Measures growth in revenue from a group of customers. Typically split into upgrades, downgrades, renewals and losses.

Measures how long it takes for a company to recoup the costs of acquiring a new customer.
LTV to CAC is a ratio that compares the lifetime value of a customer to the cost of acquiring that customer.
Getting started with ScaleXP is easy! Try it for yourself with a 7 day free trial and get set up in minutes. Or, if you’d like to take a deeper dive, book a demo at a time that suits you.
© 2024 ScaleXP | All Rights Reserved Company Number: 11447363
