

For SaaS companies, key performance indicators (KPIs) enable you to track the health of your business and find the path towards a sustainable, healthy business model. The metrics below are particularly appropriate for SaaS startups – those generating revenue and looking to scale rapidly.
If you are interested in automating these metrics and more, be sure to see how ScaleXP can automate SaaS metrics here.
1. Cash Burn & Runway
Most SaaS companies are loss making in the early years. They live from investor funding, and thus, the most critical metric is runway – months of cash remaining, or how long the company can survive without raising additional money from investors.
Cash burn & runway can be very complex to calculate as it depends on how much is spent each month, how quickly revenue is growing and even future hiring plans.
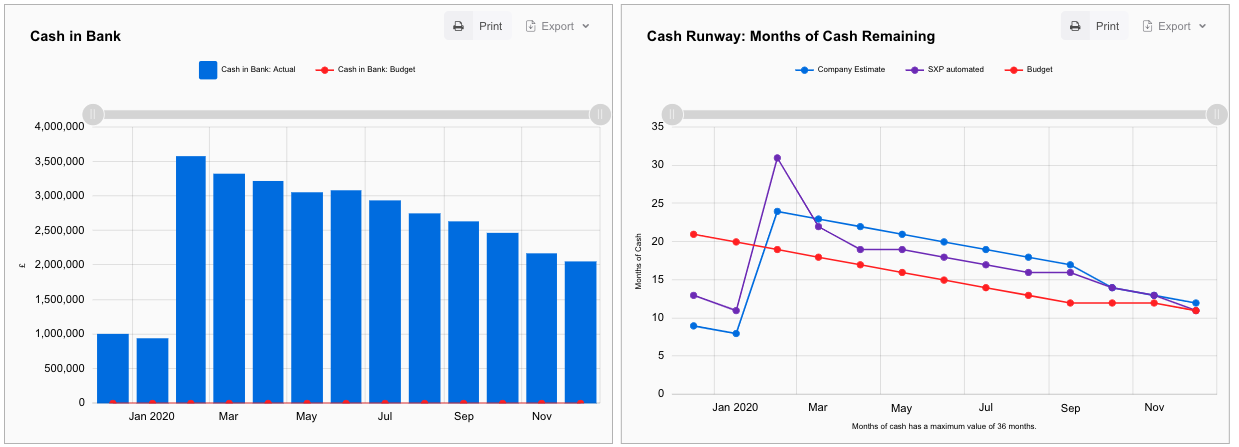
At ScaleXP, we have automated this metric using a plethora of different factors, including your current bank balance, your budget, the recent cash burn rate and customer growth rate. The cash burn analysis provides fully automated scenarios, allowing you to monitor the data in a single click each month.
2. MRR and ARR
As soon as SaaS companies start to generate revenue, measuring MRR (Monthly Recurring Revenue) and ARR (Annual Recurring Revenue) is critical.
MRR is calculated as the revenue which will reoccur next month. It is typically subscription income excluding any one-off fees. ARR is often calculated as MRR annualised (or multiplied by 12).
Which of course leads to the question about calculating MRR. This is all revenue, which will reoccur. One-off items, such as setup fees or consulting income, are typically excluded. New contracts are frequently included at the full monthly value, even if they start mid-month.
ScaleXP has built a series of sophisticated algorithms which are able to derive MRR purely from the invoices in your accounting system. It is the easiest way to track this metric, without the need to monitor each invoice or build a complex spreadsheet.
3. MRR Growth
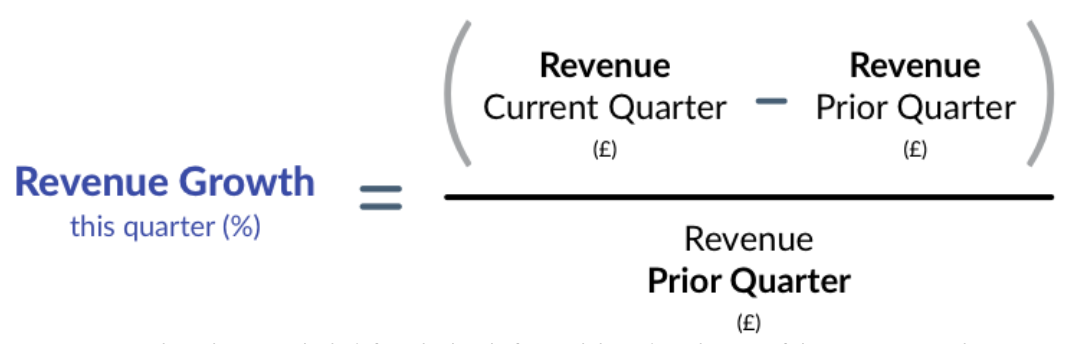
As your company starts to gain traction, showing consistent MRR Growth is critical. The calculation is simple: the increase in revenue over the month, quarter, or year.
Benchmarks exist which define the level of growth based on the size of the company. Early stage companies should grow at 300% per year. Slightly more mature businesses at 200%. For more details, see our SaaS benchmarking article on revenue growth here.
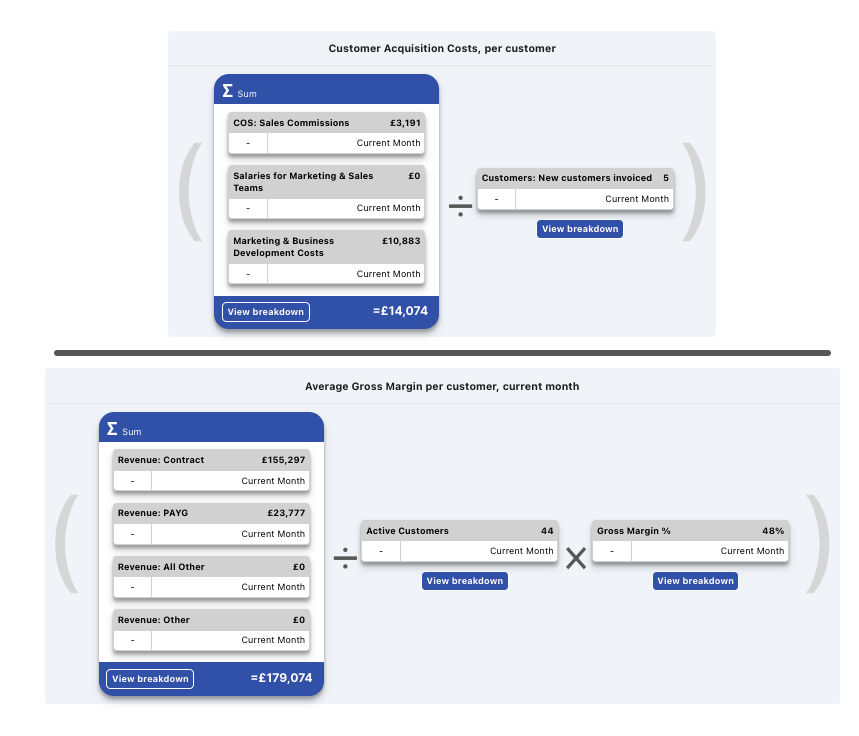
4. Customer Acquisition Costs (CAC)
CAC is the cost of acquiring a single new customer, sometimes called user acquisition cost or CCA. It is an important measure of unit economics.
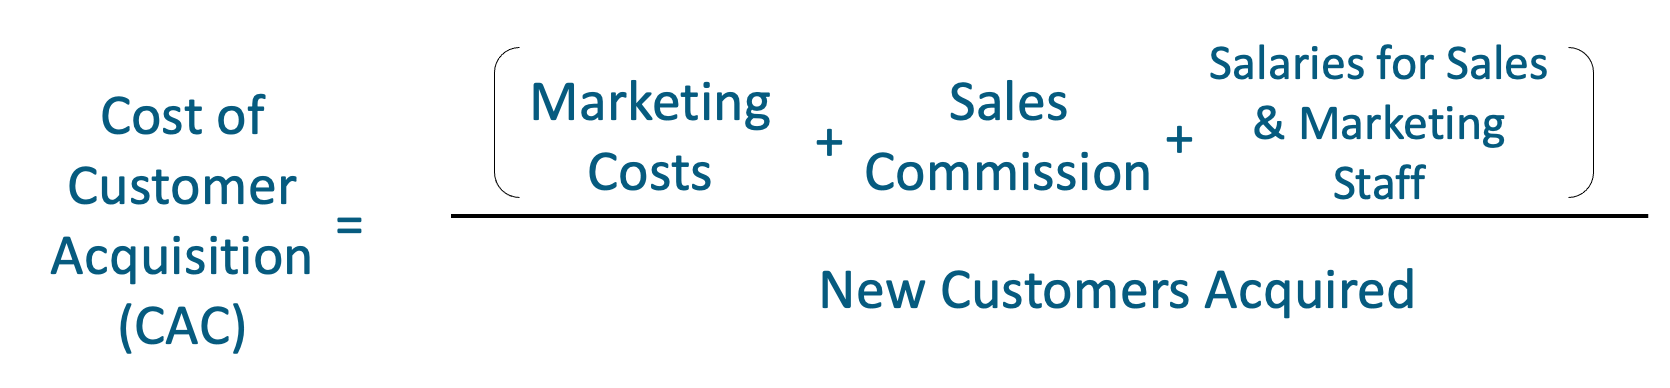
CAC is calculated by dividing the total sales and marketing cost including salaries by the number of new customers.
ScaleXP is able to fully automate this calculation using our data feeds from your accounting for invoicing system, combined with our automated text recognition tags.
Read more about what CAC is and how to calculate it here.
5. Customer Lifetime Value
Customer lifetime value is the value or profit that a customer gives the business over their lifetime. It also has a few names and abbreviations: CLTV, LTV, lifetime value.
The most common definition is the gross margin generated by a customer over their lifetime (the length of time they remain a customer).
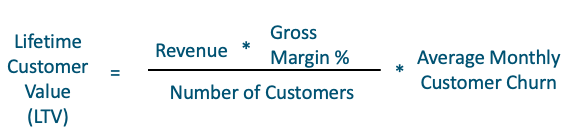
While this all might seem easy, most early stage companies struggle to calculate customer lifetime value because there is limited data about how long a customer will stay. To address this and ensure that you have an accurate lifetime value throughout your SaaS life, the ScaleXP platform uses average monthly churn as a proxy.
The system allows you to track two versions of lifetime value, making it easy to monitor the impact of different time periods (say, average churn over three or six months).
6. CAC Payback
CAC Payback is the length of time, usually months, it takes for the company to recoup the acquisition cost.
The CAC payback formula is shown below. It looks intimidating, but with ScaleXP it can be automatically built from the data in your accounting system. CAC divided by average margin per customer.
Interested in learning more? Read about CAC payback benchmarks here and about CAC and LTV here.
7. Net Dollar Retention
Net Dollar Retention measures the growth in revenue, split into its components, including new revenue, upsells, downgrades, lost revenue and reactivated customers.
It is normally shown as a waterfall graph, providing a visual view of revenue growth and the drivers.
8. Customer Churn
Customer churn is the rate or proportion of customers or subscribers that leave during a given time period.
For SaaS companies, 5-10% annual churn is generally viewed as acceptable. Companies selling SaaS products to larger enterprises usually have lower churn, whereas businesses selling to early stage companies have higher churn. For more details on customer churn, including our benchmarks, click here.
In the ScaleXP system, we import churn data from both the accounting and CRM systems, allowing you to track on a customer-by-customer basis, exactly who has left.
9. Gross Margin
Gross Margin is the profit earned on sales once cost of goods has been removed, calculated as:
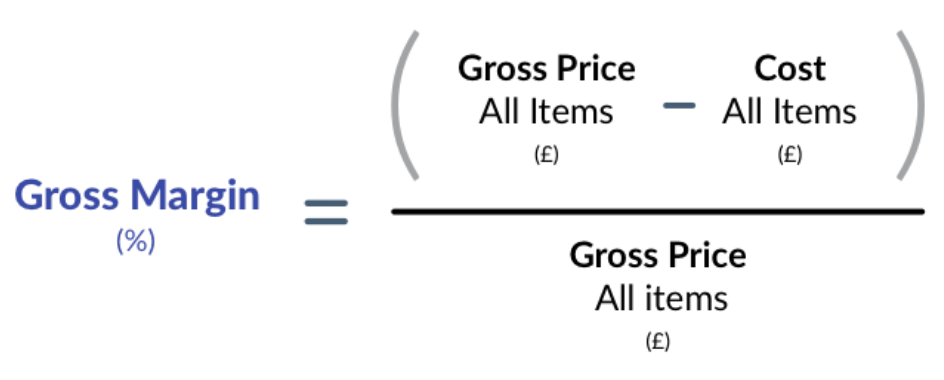
Gross Margin is arguably the best indicator of unit economics and is a key indicator of how quickly your business will move towards profitability.
Expectations of a ‘reasonable’ margin will vary depending on the size of your market.
10. SaaS Magic Number
SaaS magic number is designed to measure sales efficiency. The definition is the increase in ARR divided by acquisition costs.
As an example, if your magic number is 1, it means that the sales and marketing spend is paid back within 1 quarter. If the number is 0.5, it will take two quarters (the inverse of 0.5 or ½).
SaaS benchmarks suggest:
- Less than 0.5: Not yet ready to invest
- 0.5 – 0.75: Evaluate
- More than 0.75: Invest in growth, start to accelerate
Lars Leckie, the investor who popularised the magic number as a sales efficiency metric, commented:
“Fundamentally, the key insight is that if you are below 0.75 then step back and look at your business, if you are above 0.75 then start pouring on the gas for growth because your business is primed to leverage spend into growth. If you are anywhere above 1.5 call me immediately.”
Historically, tracking these KPIs required a lot of manual effort – exporting data to spreadsheets and calculating the recurring value of each invoice. With the ScaleXP platform, the metrics are calculated automatically as data is imported from your accounting and CRM system.
Conclusion: Mastering SaaS KPIs for Scalable Growth and Profit
These ten SaaS KPIs are critical to all early businesses. As the business grows, the challenge becomes measuring each metric in increasing levels of depth. For example, understanding CAC by channel, measuring LTV by cohort and assessing the margin by product or product line creates the ability to tailor offerings to specific customer groups – ensuring the company grows, with a thoughtful eye on the bottom line.
If you want find out more about other SaaS metrics, see this article on SaaS metrics. You may also be interested in our SaaS benchmarking series here.


