Icon of a blue money bag with a dollar sign, coins, and a bar graph representing financial growth.

What is Renewals Retention Rate?

Renewal retention rate measures the percentage of customers or subscriptions that are successfully renewed at the end of a specific period. It indicates the company’s ability to retain existing customers and maintain their business over time.

Another option is to consider renewal retention rate by value.

How is Renewals Retention Rate calculated?

Renewals retention rate divides the number of customers or subscriptions that renewed by the total number that came up for renewal. Multiply by 100 for a percentage.

Here is the formula:

Formula for calculating renewal retention rate displayed in a clear format.

For example, let’s say a SaaS company had 500 customers up for renewal in a year, and out of those, 450 renewed their subscriptions. The renewal retention rate would be:

Renewal Retention Rate = (450 / 500) * 100 = 90%

This means that the company successfully renewed 90% of its existing customers during that period.

How is Renewals Retention Rate used by SaaS companies?

Renewal retention rate directly impacts recurring revenue and long-term sustainability. A high renewal retention rate indicates customer satisfaction, product value, and effective customer retention strategies. Conversely, a low renewal retention rate may indicate customer dissatisfaction, competitive pressures, or areas of improvement needed in the product or customer experience.

What is a good Renewals Retention Rate?

A good renewal retention rate varies by target market, pricing model and the product itself. Higher is better, and SaaS companies commonly aim above 90%.

The most useful comparison is usually internal. Track against your own prior quarter or year, because the goal is steady improvement rather than hitting someone else’s number.

What are the Renewals Retention benchmarks?

There is no single universal renewal-rate benchmark, because the industry has never agreed a single definition of one. What does exist is consistent 2026 data for the two things “renewal rate” usually means — customers renewed and revenue renewed — and those are set out below.

Renewals retention benchmarks for 2026

Renewal rate is one of the few SaaS metrics with no agreed definition, so published benchmarks for it are rarely comparing the same thing. The practical approach is to be explicit about which version you are measuring, then benchmark against the closest metric that is consistently reported.

91%
Revenue renewed, bootstrapped $3m–$20m
84%
Revenue renewed, broader market
62%
Customers renewed on annual plans
41%
Customers renewed on monthly plans

How you bill changes whether they renew

Annual customer retention on low-value plans, by billing frequency.

41%
Monthly billing
62%
Annual billing
Twenty-one points, on the same kind of customer paying a similar amount. An annual contract removes eleven monthly opportunities to leave and gives customer success a scheduled conversation instead of a silent lapse. For low-value plans, moving customers to annual billing is usually a bigger retention lever than any product change.

Two things are both called the renewal rate

MeasureWhat it countsDenominator2026 reference point
Logo renewal rateContracts or customers renewedContracts eligible to renew in the period62% annual plans, 41% monthly, at low ARPA
Revenue renewal rateRecurring revenue retained, excluding expansionARR eligible to renew in the period91% bootstrapped $3m–$20m; 84% broader market

There is no agreed standalone definition of a renewal rate, which is why published figures for it disagree so widely. Before comparing yourself to any of them, settle two questions: are you counting customers or dollars, and is the denominator everything you have or only what was actually up for renewal in the period? A rate measured against the whole base will always look better than one measured against contracts genuinely at risk.

Why gross revenue retention is the usable proxy

Because renewal rate is defined inconsistently, almost nobody benchmarks it directly. Gross revenue retention measures nearly the same thing — revenue kept from existing customers, expansion excluded — and it is benchmarked consistently across thousands of companies. Using it means you can compare against a real distribution rather than a number someone defined privately. The one thing to hold on to is that GRR runs across the whole base continuously, while a renewal rate looks only at contracts reaching their renewal date, so the two will not match exactly even when both are calculated correctly.

Bootstrapped companies renew better
The 91% figure for bootstrapped companies at $3m–$20m ARR sits seven points above the 84% median across the wider market, and their net retention is 103% against 102%. Smaller, capital-efficient companies tend to sell to customers they can actually serve, and it shows up in renewals. It is a useful reminder that the broad market median is not automatically the right target for your business. See the full retention benchmarks →

Sources: bootstrapped gross revenue retention from SaaS Capital’s 2026 bootstrapped benchmarks. Billing-frequency retention from ChartMogul’s SaaS billing report, covering plans under $25 average revenue per account. Broader-market GRR from the 2026 Aleph × Benchmarkit benchmarks, 342 companies.

See what is renewing

Know what is renewing—and what is still at risk.

ScaleXP connects renewal dates, contract values and customer data. Track renewal performance by customer count and revenue value, while keeping the ARR still exposed to non-renewal clearly visible.

Separate customer renewal rate from revenue renewal rate—they answer different questions.

Automate Your SaaS Metrics

Example connected renewals view

  • Contracts due: 500 customers / $1.00m ARR
  • CRM: HubSpot, Salesforce, Pipedrive

Customer renewal rate

90%

450 of the 500 customers due for renewal completed their renewal.

Illustrative example figures, not your live data.

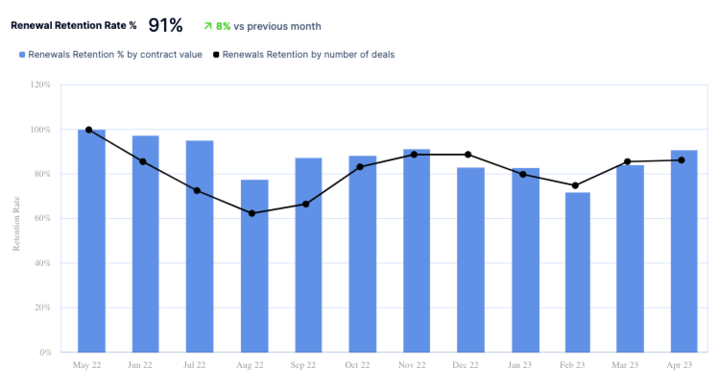
Renewals Retention Rate visualisation example

Bar chart displaying renewal retention rates over several months with a line graph overlay.

ScaleXP calculates a full suite of SaaS metrics automatically, every month.

It connects to your accounting system and your CRM — Xero, QuickBooks, HubSpot or Salesforce — then builds a revenue recognition schedule. Charts like these follow, showing ARR against budget or latest forecast.

For Xero, QuickBooks and Zoho Books

Give every renewal a clear next action.

ScaleXP brings renewal dates, contract values and CRM activity into one finance-owned view. See upcoming renewals, prioritise the revenue at risk and keep the forecast current as customers renew.

Book a Demo No preparation needed

From contract dates to a controlled renewal process

ScaleXP brings together customer contracts, renewal dates, values and ownership information.

You may also be interested in

Icon representing customer retention rate with a hand and user silhouette in blue.

Customer Retention

Percentage of existing customers who remain customers after a given period.

Blue icon depicting a money bag alongside a graph showing financial growth.

Gross & Net Revenue Retention

The percentage of revenue that a company retains from its existing customers over a given period of time.

Chart illustrating the relationship between LTV and CAC metrics in a business context.

LTV:CAC

Lifetime value divided by acquisition costs, indicating the margin delivered by each new customer.

SAAS METRICS LIBRARY

Read about more SaaS metrics, from ARR to Rule of 40.