For the latest SaaS Benchmarks click here.
This is the fifth article on SaaS benchmarks. In this article, we focus on R&D spend including tech headcount for SaaS companies at five stages in their growth journey, from Seed to Series D. The article will answer these questions:
- Why is measuring R&D spend important?
- What are the best ways to measure R&D?
- How much do big tech companies spend?
- How much should I spend as a smaller SaaS company?
Our objective is to provide all of the data that you need to assess if your SaaS company is spending in line with market norms, based on the size of your business, in a quick 3 min read.
If you haven’t already, we invite you to book a demo where we will show you how ScaleXP helps to track all of your critical business metrics automatically in under an hour.
Why is measuring R&D spend important?
In the early days, spend on R&D is the most material cost for SaaS companies outpacing all other items. Understanding if your spend on R&D is consistent with the norm is a useful gauge of capability.
As a business starts to scale, having achieved a solid product market fit, R&D spend is a useful indicator with which to stimulate internal debate as to whether or not momentum will be lost further down the line due to lack of further innovation investment.
What is the best way to measure R&D?
The best way to assess R&D spend is through:
- Number of R&D or tech employees
- R&D as a % of Revenue:
- R&D Productivity
Number of R&D employees: This typically includes employees and contractors in both the software development and product teams, including those who work on tech debt and new features.
R&D as a % of Revenue is calculated as the total cost of the tech and product teams (salaries, pensions, cost of their tools and equipment) divided by revenue. This metric is readily available for larger SaaS companies, including those that IPO, and thus is useful in determining the gold standard for SaaS companies
R&D Productivity: This is a performance measure of how much new revenue is associated with each £/$ invested into R&D. It is certainly the hardest to calculate but is the most insightful measure for long term growth, with clear differences between the SaaS companies that lead their markets.
These measures are consistent across geographies and different types of SaaS businesses, which is essential in compiling benchmark data.
Is there a gold standard?
The gold standard, in our opinion, can be defined as SaaS companies that grow quickly and ultimately IPO.
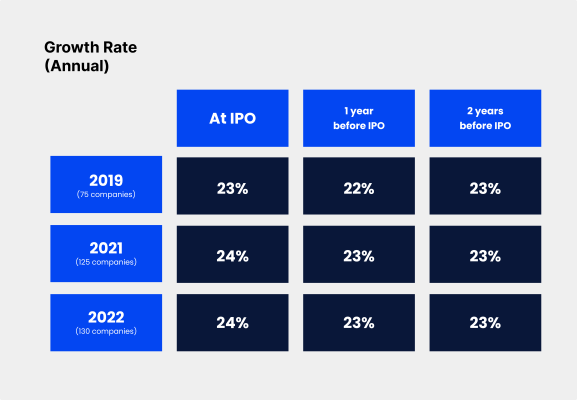
To determine the R&D at these companies, we assessed spend at 90 SaaS companies which IPOed in the last three years. On average, their spend is around 25%. In the table below, the top number is average; the bottom is median. (Media is the number in the middle of the data set.)
Interestingly, once companies IPO their spend on R&D falls. The consulting firm BCG found that across all software publicly listed companies, spend on R&D is between 17% and 26%, depending on the speed of their growth. Higher growth companies spend more, which reinforces their position at the top of the growth charts.
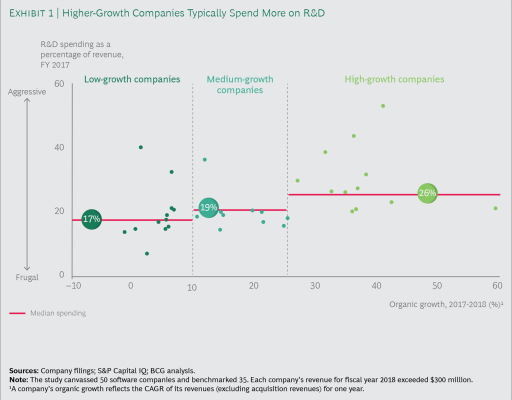
This data is specific to SAAS companies but derived from publicly listed businesses and thus only includes larger businesses. Sourced from S&P Capital.
For smaller companies, what R&D spend is normal?
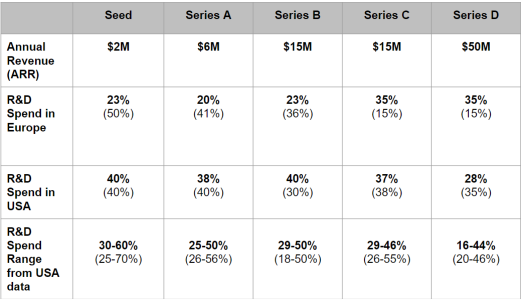
To help answer this question, we read every benchmarking study we could find published in the USA and Europe. The data is shown in Image 2 below.
Data is shown for 2022 in bold and for the prior year in italics. Annual revenue is provided as a gauge to company size. European benchmarking data tends to be collected about six months after the USA data but figures for 2022 are not yet released, so the European data is slightly older.
Key conclusions are:
- European Seed, Series A and Series B companies reduced R&D spend significantly following covid. In most cases, the reduction was close to 50%. Larger European companies in contrast increased spend.
- USA SaaS companies spent more building their software teams initially. Seed stage companies in the USA report spending 40% of their early revenue on R&D, whereas in Europe, this is 23%. This reflects post covid declines and is a very material difference.
- These figures are substantiated by other data points from Europe an teh USA. As an example, USA Seed companies have 10 employees in the product and tech teams, compared to 6 in Europe.
- By Series C, around $15M ARR, the gap disappears. This is also consistent with other data which shows that from Series C onwards, SaaS funding markets are global with few differences between European companies and their American counterparts.
At face value, this data could suggest that European companies deliver results at lower cost, bringing their products to market with less upfront investment. This conclusion would be interesting, and certainly result in US VC money flowing into Europe. Sadly, our deep dive into the data highlights that the overall spend is not materially different. European companies spend less on their tech but replace this with marketing spend, spending faster in marketing and sales at Seed and Series A.
Lower R&D spend in Europe is concerning, particularly because there is a growing body of research from Product Led Growth which shows that spending on product early (Seed and Series A) is the most effective way to fuel long term growth. The fact that European companies seem to be underspending their American counterparts may result in less European initiation.
And what about R&D productivity?
R&D productivity is the most complex of the three metrics. It tracks how much new revenue is associated with each major R&D initiative, and is calculated as:
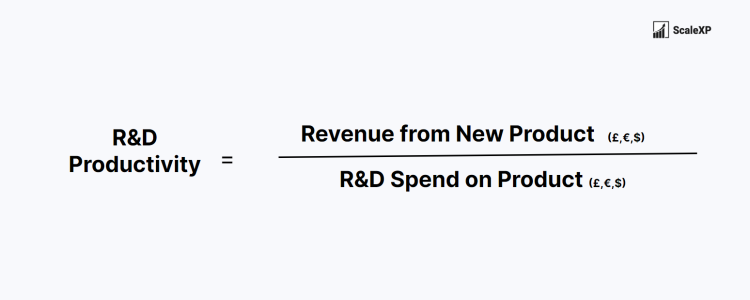
This metric – which becomes relevant from Series B – requires splitting R&D costs into maintenance (or dare I say tech debt) spend and new product development. Spend on new product development is then tracked for material new features, which are expected to generate revenue.
Tracking R&D spend by initiative and comparing it to revenue may seem tedious but there are simple ways that much of this data can be captured and automated.
And so what can we learn from this measure…..Mid-sized (Series C+) SaaS companies on a fast growth trajectory have an R&D productivity measure between 2 – 3. World class R&D productivity is closer to 10+. This means that companies with a slower growth trajectory will recoup 2 or 3 times their R&D spend on new products. The top recoup 10. This data is compiled by OpEx Engine, having tracked both privately owned and public SAAS companies.
This metric ultimately highlights the level of detailed tracking which is put in place at the highest growth SAAS companies. It is one of the most important critical success factors for early stage companies, with mountains (yes entire mountains!) of data showing that the strongest performing companies are data driven and ensure that the right KPIs are in place early. You can see some of those KPIs and metrics in our SaaS metric library.
The data is so compelling that reputable McKinsey concluded that “top SAAS performers insist on transparent data and metrics that allow them to gain an integrated view of growth and margin drivers.”
Data such as R&D spend as a % of Revenue, customer growth, net revenue retention, ARR, MRR, CAC, should be available each month, compared to your own targets, even for companies at seed stage.
And finally….what’s next?
ScaleXP provides SaaS companies with a market-leading, fully automated view of all their key metrics, including those most vital to investors in 2023. By connecting with both your accounting data and your CRM platform, our solution empowers you to track benchmarks and measure performance with unparalleled ease.
If you’re ready to take your metrics tracking and benchmarking to new heights, click here to get started with ScaleXP. Enhance your company’s data-driven decision-making and stay at the forefront of the curve with ScaleXP.
Subscribe to our newsletter
If you found this article or any other article on our website helpful, you can join our monthly newsletter where we will be sharing all of our new reports exclusively with you.

