

For direct-to-consumer businesses, key performance indicators enable you to track the health of your business and find the path towards a sustainable, healthy business model.
This article, and the list of KPIs, has been prepared by Samira from Pink Salt Ventures. Thank you, Samira!
The metrics below are particularly appropriate for direct to consumer (DTC) e-commerce businesses, selling online only. They are designed to highlight how effectively you are running your business and where you may need to re-focus.
1. Revenue or Sales
The most important headline metric for so many companies, and a starting point for understanding performance. Items 4, 8 and 10 provide greater detail on the drivers behind this number.
2. Revenue Growth or Rate of Sales Growth:

What is your monthly, quarterly and annual growth rate? Are you stagnating or accelerating? How much market share can you capture? Your growth rate demonstrates the effectiveness of your new business activities and whether they are resonating with your potential customers. The metric applies to new and improved sales and marketing campaigns, new product launches, or even entry into new markets.
3. Customer Acquisition Costs (CAC)
The cost of acquiring new customers.

One of the most essential metrics when it comes to the health of the business. Whilst customer acquisition costs are expected to be high when launching a business, this metric is such a great indicator of the sustainability of growth, literally one half of whether you can be sustainable over the long term.
CAC is calculated by dividing the total sales and marketing cost including salaries by the number of new customers.
4. Customer Lifetime Value
Margin generated by a customer over its lifetime.

The other half of the equation. Once you have acquired a customer, how much value do they generate? Can you increase lifetime value by adding new products or services? You want to calculate this number over a set time period for an e-commerce business. There are more detailed ways to calculate LTV, whilst the most accurate is the best, in the early days when you have limited data a heuristic calculation as shown in the formula above works fine.
Another related KPI that you should track consistently is the % of your customer base who are returning customers. The cost of re-engaging lapsed customers is much lower than the cost of acquiring new customers, as you already have their details. However, if customers aren’t coming back for more, this could be a warning sign about the quality of your products. Having no returning customers makes your business very expensive to operate.
5. CAC:LTV ratio
The CAC to LTV ratio indicates the margin the company will earn from a customer after acquisition costs.
This ratio puts the two halves together, ultimately a customer should generate more value than they cost to acquire, otherwise you will never be able to achieve profitability or sustainably run your business. If your customer acquisition costs are extremely low relative to the lifetime value of your customer, you have an extremely profitable business model, highly effective marketing or a sticky offering that locks customers in over the long term. Whatever that marketing secret sauce is, don’t be dismayed if it changes as you mature within your market and need to compete against established incumbents, where marketing spend will likely increase.
6. Traffic
Number of users viewing your content, how effective your marketing is across channels, website/email/social channels.
Traffic is the digital equivalent of footfall in stores. How many people are coming to your shop, and how did they find you? Figuring out the most effective marketing channels to generate traffic to your site allows you to focus your resources there. This also gives you insight into your customer demographic and user behaviour, you will likely have a number of hypotheses in this area. For example, millennials may well find you through Instagram, whereas email marketing can be a highly effective channel for older demographics. You want to focus on the marketing channel that generates the most relevant traffic. Organic traffic is always favourable to paid for traffic, it indicates you either do in-house marketing very well without the need for paid, or your product is being recommended among peers. Winning either way.
7. Conversion rate
Conversion rate = # of Purchases / # Unique Visitors
Once customers are in your virtual shop, are they buying products? What’s the conversion rate? This KPI gives you an insight to the effectiveness of your user experience and the path to purchase. For example, perhaps customers are putting products in the basket or coming to the site, but they aren’t buying. Figuring out the answers to why that is enables you to diagnose the issue and address it; whether it is to do with your product quality, marketing messaging, pricing, or your user experience.
8. AOV, or Average Order Value
AOV = Total Sales / # Customers

When analysing your customers, you want to know what the average order value is. How can you develop your user experience to encourage customers to increase their basket size? By adding new product lines to increase the basket size, or by offering different product bundles? Ultimately the higher your average order value, the higher your net profit, especially given ‘digital rent’ and the cost of doing business; online ad-spend, shipping and logistics.
9. Gross Margin
Gross Margin is the profit earned on sales once cost of goods has been removed, calculated as:
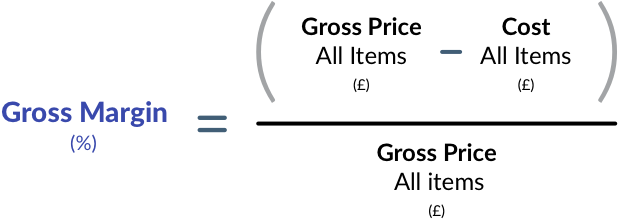
Gross Margin is arguably the best indicator of unit economics. If you have tiny margins, substantial scale will be required to survive, think Amazon. If you have larger margins, you can survive with fewer customers, think LVMH. Low margins can signal to investors that your business may struggle to reach sustainable profitability. Their expectations of a ‘reasonable’ margin will vary depending on the size of your market.
10. Returns, percentage of goods returned by customers
Returns fundamentally indicated how satisfied customers are with your product. Whilst you may have top-notch sales metrics, if you have an extremely high return rate, something is wrong. Perhaps you are over promising in your marketing materials, or you have product quality issues. A high number of returns is a massive risk to any e-commerce business and need to be addressed quickly. Context here is important, particularly in segments like fashion where ‘fit’ will naturally cause a higher return rate than beauty products, which may have no return policy due to health and safety requirements.
Conclusion
These ten are critical to all direct-to-consumer companies. As the business grows, the challenge becomes measuring each metric in total and increasing levels of depth. For example, understanding CAC by channel, measuring LTV by cohort, and assessing the return rate by product or product line will create the ability to tailor offerings to specific customer groups, ensuring the company grows, with a thoughtful eye on the bottom line.

How to automate prepaid expenses
Automating prepaid expenses, the costs a business pays upfront for future goods or services, not only saves time but also
How to automate HubSpot billing in QuickBooks
Easily invoice Hubspot deals in QuickBooks using ScaleXP Looking to streamline your billing process between HubSpot and QuickBooks? If your
Revenue recognition automation
Revenue recognition: a guide Revenue recognition is a crucial aspect of financial reporting, ensuring that companies accurately reflect their earned