What is Revenue Churn?
Revenue churn is the amount of recurring revenue lost over a specific period due to customer cancellations, downgrades, or price reductions. It measures the rate at which the company is losing its existing revenue stream.
How is Revenue Churn Calculated?
Revenue churn is typically expressed as a percentage and calculated by dividing the lost recurring revenue during a given period by the total recurring revenue at the beginning of that period. The resulting percentage reflects the proportion of revenue that has churned, or Gross Revenue Churn.
Net Revenue Churn is the same as Gross Revenue Churn, but revenue lost in the period is offset by upsells and price increases to existing customers.
Net revenue churn = current period revenue lost, downgraded less upgraded divided by value in prior period
Gross revenue churn is same but excluding upgraded offset.
For example, if a SaaS company has $100,000 in recurring revenue at the start of the month and loses $10,000 in recurring revenue during that month, the revenue churn rate for the month would be 10%. This means that 10% of the company’s recurring revenue has churned during that month.
Comparisons of revenue churn rate are annual. Therefore monthly results are taken to the power of 12 and quarterly results are taken to the power of 4 to get the equivalent annual revenue churn rate.
How is Revenue Churn different from Customer Churn?
Revenue churn focuses on revenue rather than customer numbers and takes into account not only lost customers but also downgrades or reductions in pricing plans by existing customers that result in decreased revenue.
How is Revenue Churn Rate used by SaaS Companies?
By understanding and reducing revenue churn, companies can improve customer retention, enhance their product offerings, and optimise revenue growth.
What is a good Revenue Churn Rate for SaaS Companies?
There is no “good” or “bad” revenue churn rate, as it can vary greatly depending on the industry and the specific business. However, a low churn rate is favourable.
Measuring churn consistently to ensure that it is stable or decreasing is important.
What are the benchmarks for Rustomer Churn?
Customer churn is difficult to benchmark as definitions vary widely by company. Net Dollar Retention is a more typical measure of customer stickiness, which is widely benchmarked. See full details here.
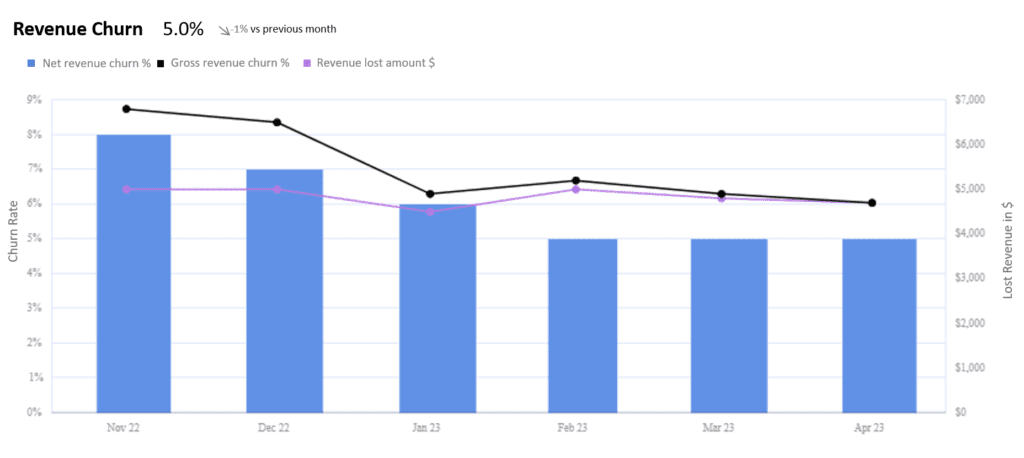
Revenue Churn Visualisation Example
This chart is an example of revenue churn rate, with year on year comparisons, making it much easier to understand trends, improvements, even seasonality.
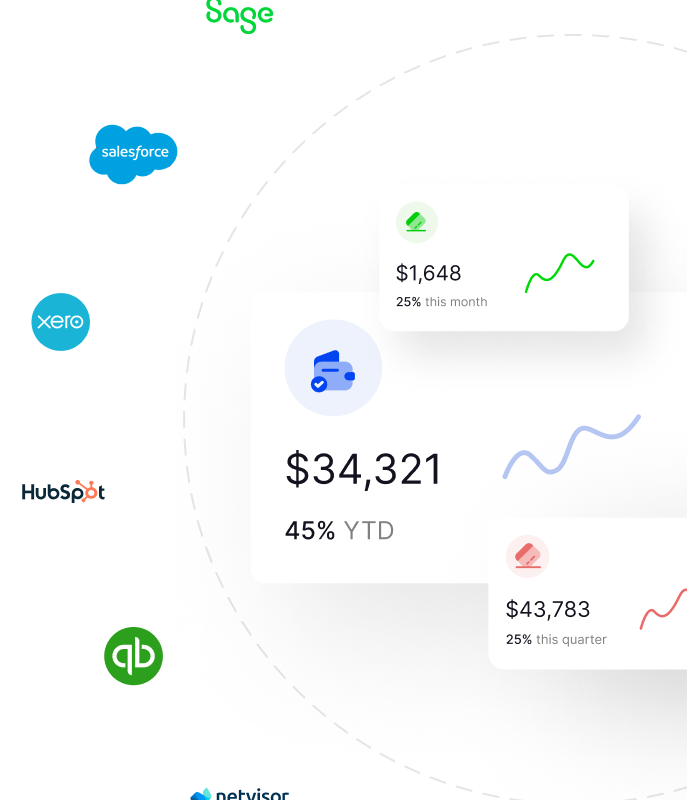
ScaleXP fully automates revenue churn. Through integrations with both your accounting and CRM systems, as well as a smart set of text recognition algorithms, the system provides a full suite of SaaS metrics. Customers are automatically tagged as Active, New or Lost using your business definitions.