
See how ScaleXP works with Xero, QuickBooks or Zoho Books.
In a 30-minute demo, we’ll show the relevant workflows using example data and discuss how they could apply to your finance process. Complex requirements? Discuss them with us first.
Understand customer lifetime value, calculate it with your own numbers, see how the LTV:CAC ratio benchmarks against other SaaS companies, and get practical tips to improve it.

CUSTOMER LIFETIME VALUE
No benchmark exists for lifetime value in dollars.
Lifetime value scales directly with your price point. What is benchmarkable is value measured against what it cost to acquire.
2026 benchmark · 146 of 342 B2B SaaS companies
This article will provide
SaaS lifetime value predicts the total value a customer brings across the whole relationship. It is usually shortened to CLTV or LTV.
To calculate it, you need three things:
The formula is:
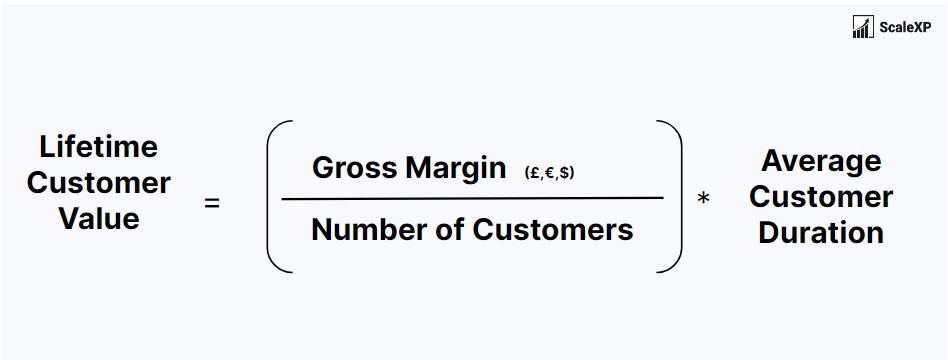
Written out, the formula in the diagram is:
Lifetime value = (gross margin ÷ number of customers) × average customer duration
Most teams use the equivalent churn-based form, because it needs no measured duration:
Lifetime value = average revenue per account × gross margin % ÷ churn rate
The two are the same calculation. They agree whenever average customer duration equals 1 ÷ churn rate.
Using gross margin rather than revenue is what makes lifetime value comparable across business models. A company delivering at 80% margin genuinely earns more from an identical contract than one delivering at 40%, and a revenue-only figure hides that difference completely.
That $1,875 only means something next to what the customer cost to win. See the LTV:CAC ratio for the comparison, customer acquisition cost for the other half of it, and customer churn for the input that moves it most.
No figure for average customer duration? You can estimate it by dividing 1 by your churn rate — at 2% monthly churn that implies a 50-month life. Treat the result as a rough upper bound rather than an answer. The shortcut assumes churn never changes, and for any cohort with net revenue retention above 100% it returns an infinite lifetime. Where you have two years or more of history, measure realized lifetime from actual cohorts instead; where you do not, cap the estimate at a stated horizon such as three or five years and publish the horizon alongside the number.
Definitions, formulas, and this year’s median and top-quartile numbers for all 20 metrics in the library. One PDF you can take straight into your next board meeting.
See our privacy policy.
Your report is ready.
Download the 2026 SaaS Benchmark Report We’ve emailed you a copy as well.Lifetime value matters because it sets your acquisition budget. It tells you what a customer is worth, and therefore what you can afford to spend winning one.
Compare it with acquisition cost (CAC) and you get the return on your acquisition spending. That ratio is what decides where the next dollar of budget goes.
Lifetime value is the metric least suited to a single benchmark figure. It varies by more than twenty times between the smallest and largest customer segments, and two reasonable analysts can produce very different answers from identical data depending on how they define it. What follows is the segment picture, and the two definitional choices that matter most.
Median LTV:CAC, from two independent 2026 studies.
| Segment | Indicative lifetime value | Typical customer life |
|---|---|---|
| SMB | $15,000 – $40,000 | 2–3 years |
| Mid-market | $80,000 – $200,000 | 3–5 years |
| Enterprise | $300,000 – $1,000,000+ | 5–7+ years |
There is deliberately no single market average here, because there is no useful one. Lifetime value spans more than an order of magnitude between the top and bottom of this table, and it moves with contract value, gross margin, expansion rate and the horizon you choose to forecast over. A company comparing itself to a blended average is comparing itself to nothing in particular.
Revenue or gross margin? Lifetime value built on revenue overstates what a customer is actually worth. At an 80% software gross margin the margin-adjusted figure is a fifth lower, and against a CAC that is a real cash number, that difference decides whether the ratio clears 3:1. State which basis you are using every time you publish the number.
Do not divide one by churn without a horizon. The 1 ÷ churn shortcut assumes churn stays constant forever. Applied to a cohort with net revenue retention above 100% it returns an infinite lifetime, which is why some LTV figures look implausibly large. Where you have 24 months or more of history, cohort-based realized lifetime value is the more defensible number; where you do not, cap the forecast at a stated horizon and say what it is.
Sources: segment lifetime-value ranges and the 3.2x median from Optifai’s 2026 B2B SaaS LTV study of 939 companies. Median 4.1x and top quartile 7.8x from the 2026 Aleph × Benchmarkit benchmarks, 342 companies. Ranges are indicative rather than medians, and should be read as orders of magnitude by segment.
Value the customer relationship
ScaleXP combines actual customer revenue, gross margin and realized retention so lifetime value reflects how customers behave—not an indefinite 1 ÷ churn shortcut.
Finance-owned definitions, an explicit forecast horizon and one consistent calculation across every reporting period.
Automate Your SaaS MetricsExample connected lifetime-value view
Monthly customer revenue
$1,000
The average recurring revenue generated by the customer each month.
Illustrative example figures, not your live data.
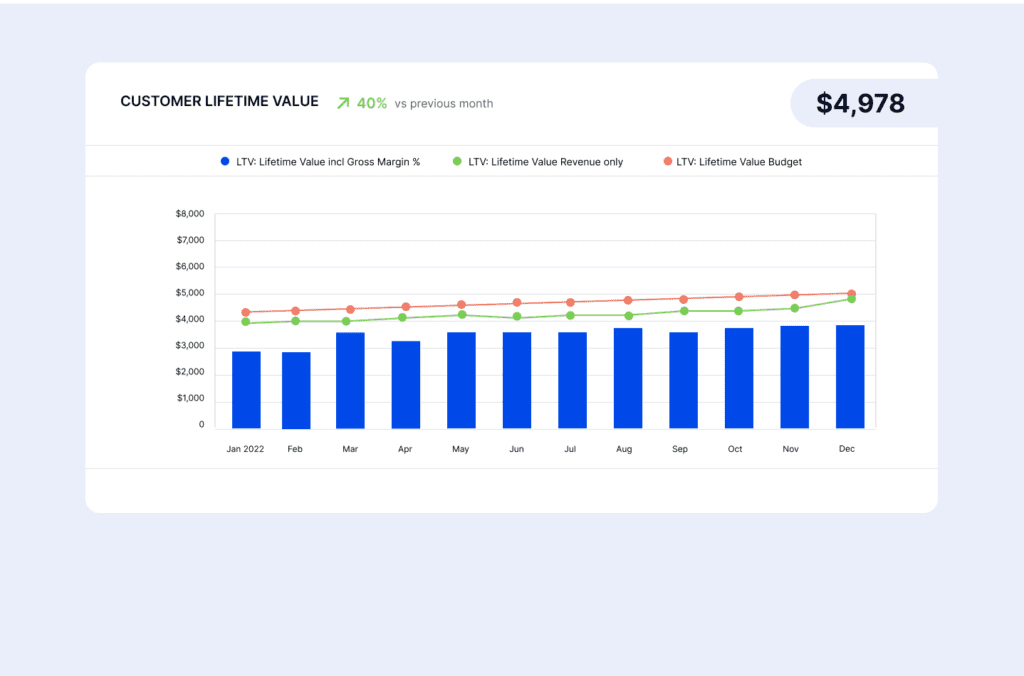
This chart shows SaaS lifetime value with month-on-month and budget comparisons. Trends, improvements and seasonality all become easy to read at a glance.
Investors care about customer lifetime value (CLV) because it shows how much each customer is worth over the whole relationship, and therefore how much a business can afford to spend winning them. Set against acquisition cost, CLV produces the LTV:CAC ratio, where the 2026 median is 4.1x and the top quartile reaches 7.8x. Retention sets the ceiling on CLV, so investors read it as a test of how sticky the product is. ScaleXP calculates customer lifetime value automatically from real revenue, margin and retention data, giving investors a defensible number.
Yes, ScaleXP calculates customer lifetime value (LTV) automatically from revenue and gross margin in Xero, QuickBooks or Zoho Books and customer data in HubSpot, Salesforce or Pipedrive. Retention and churn are measured from actual customer behavior, so lifetime value reflects how customers really behave, not an assumed lifespan. ScaleXP prepares LTV daily using finance-owned definitions, alongside 30+ other SaaS metrics. Finance teams stop calculating lifetime value by hand and gain a figure they can defend in front of the board.
ScaleXP keeps CLV consistent with the accounts because customer lifetime value is built on gross margin from Xero, QuickBooks or Zoho Books, not on revenue alone. Cost of sales comes from the same ledger that produces the P&L, so a change in hosting or support costs flows straight through to lifetime value. Finance decides the forecast horizon and margin definition once, and ScaleXP applies it every period. The result is an LTV figure that reconciles to the financial statements and stands up to investor due diligence.
Yes, ScaleXP shows customer lifetime value by segment and cohort in live dashboards and PowerPoint board packs, alongside CAC, LTV:CAC and CAC payback. Finance teams can compare SMB, mid-market and enterprise customers and see which segments deliver the most value for the acquisition spend. In presentation mode, directors drill down from the headline CLV to the customers behind it. Leadership gets a clear view of which customers are worth acquiring and keeping, backed by numbers the board trusts.
For Xero, QuickBooks and Zoho Books
ScaleXP calculates LTV from actual revenue, margin and retention, then keeps the result current as customer behavior changes. Pair it with CAC and make acquisition decisions from finance-owned numbers rather than assumptions.
From customer data to a defensible LTV
ScaleXP brings together customer revenue, subscription history and finance data from your connected systems.
ScaleXP automates lifetime value end to end. Definitions are simple to customize, your finance systems connect directly, and revenue recognition runs automatically alongside your other KPIs.

Lifetime value divided by acquisition costs, indicating the margin delivered by each new customer.

Measures how long it takes for a company to recoup the costs of acquiring a new customer.
““producing more insights, faster and with greater accuracy”
SaaS metrics
ScaleXP calculates customer lifetime value and 30+ other SaaS metrics straight from your accounting and CRM data, prepared daily.
In a 30-minute demo, we’ll show the relevant workflows using example data and discuss how they could apply to your finance process. Complex requirements? Discuss them with us first.