
See how ScaleXP works with Xero or QuickBooks.
In a 30-minute demo, we’ll show the relevant workflows using example data and discuss how they could apply to your finance process. Complex requirements? Discuss them with us first.
Understand the LTV:CAC ratio, calculate it with your own numbers, see how it benchmarks against other SaaS companies, and get practical tips to improve it.

This article will provide
The LTV:CAC ratio compares the lifetime value of a customer to the cost of acquiring that customer. It is a key SaaS metric because it shows how efficiently you are buying growth.
Tracking the ratio over time reveals trends in acquisition efficiency. You can then adjust where and how you spend to improve profitability.
The formula for LTV : CAC is Lifetime Customer Value, divided by Customer Acquisition Cost, as shown below.
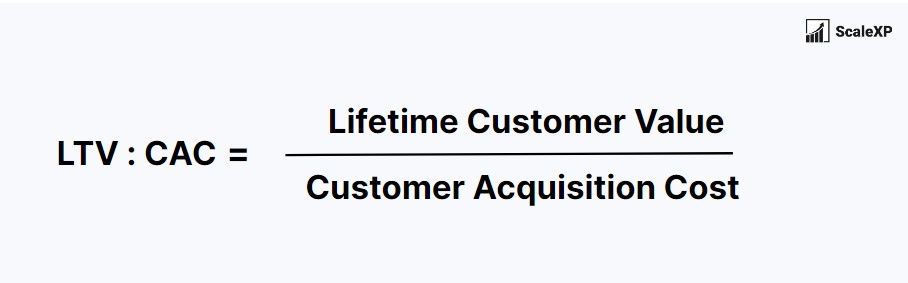
Lifetime value against acquisition cost: $24,000 ÷ $6,000 Use gross profit, not revenue, in lifetime value.
Keep reading to see how that compares with the industry benchmark.
Your result
That puts you right at the 2026 median of 4.1x. The top quartile reaches 7.8x or higher.
One number against one benchmark only tells you so much. The 2026 benchmark report has the median and top-quartile figures for all 20 metrics, so you can see where the rest of the business sits.
Definitions, formulas, and this year’s median and top-quartile numbers for all 20 metrics in the library. One PDF you can take straight into your next board meeting.
See our privacy policy.
Your report is ready.
Download the 2026 SaaS Benchmark Report We’ve emailed you a copy as well.The ratio is quoted so often that the two numbers inside it get lost. They sit at opposite ends of the same customer, and they are not the same kind of number at all.
CAC is a cost. It is incurred once, up front, before the customer has paid anything, and it is known with reasonable precision because the money has already left. LTV is a forecast of gross profit earned across the whole relationship, and it is an estimate built on assumptions about churn and margin that may not hold.
| CAC | LTV | |
|---|---|---|
| What it is | The cost of winning one customer | Gross profit expected from one customer |
| Timing | Paid up front, once | Earned over the whole relationship |
| Certainty | Actual spend, already known | A forecast, driven by churn and margin |
| Moved by | Channel mix and sales efficiency | Retention, pricing and gross margin |
| 2026 benchmark | $1.30 of S&M per $1 of new ARR | Median LTV:CAC of 4.1x |
That asymmetry is why the ratio is more fragile than it looks. One side is money already spent; the other is a projection, and it moves further on a retention assumption than on anything acquisition does. Read it alongside CAC payback period, which uses the same two inputs but answers in months rather than a multiple, and see customer lifetime value and customer acquisition cost for how each side is built.
SaaS companies use the LTV:CAC ratio in four main ways.
A high LTV:CAC ratio means you acquire customers cheaply and those customers are valuable. That is a signal you can safely spend more on growth.
Calculate the ratio for each channel or campaign. Then move budget toward the channels that bring in valuable customers most efficiently.
Comparing lifetime value against customer acquisition cost shows the return on your acquisition spend. That return tells you whether your pricing works.
Lifetime value and the LTV:CAC ratio make revenue projections more accurate. Both help you plan future growth with fewer assumptions.
There is no single good LTV:CAC result for every business. The right ratio depends on your industry, your target market and your cost of delivery.
As a guide, a ratio of 3:1 or higher is usually considered strong. It means each customer returns at least three times what it cost to win them.
A low ratio points to one of two problems. Either you are spending too much to acquire customers, or the customers you win are not valuable enough. Both call for a review of your sales and marketing approach.
The aim is to acquire valuable customers at the lowest sensible cost. Tracking the ratio over time shows whether you are moving in the right direction.
The 3:1 guideline is a floor, not a target. The current median is 4.1x and the top quartile reaches 7.8x — and the ratio splits sharply depending on whether the product serves one industry or many. A second study of 939 companies puts the median slightly lower at 3.2x, which is a useful reminder that the exact figure moves with how lifetime value is defined.
Median LTV:CAC ratio.
| Measure | Horizontal SaaS | Vertical SaaS |
|---|---|---|
| LTV:CAC ratio | 4.1x | 5.6x |
| CAC payback | 14 months | 18 months |
Vertical software takes four months longer to recover its acquisition cost, and still returns 37% more across the customer's life. The two metrics disagree because they measure different things: payback measures speed, LTV:CAC measures durability. If you optimize only for payback you will systematically favor the customers who leave soonest.
| Measure | Top quartile | Median | Bottom quartile |
|---|---|---|---|
| CAC payback | 10 months or less | 16 months | 24 months or more |
The 33-cent gap between the two is the value of the existing customer base. Expansion revenue is roughly a quarter cheaper to win than new business, which is the arithmetic case for funding customer success ahead of new sales.
Source: 2026 Aleph × Benchmarkit SaaS & AI Performance Benchmarks, published 1 June 2026, reporting full-year 2025 actuals from 342 B2B SaaS and AI-native companies. CAC payback was reported by 198 of them. LTV:CAC median and quartiles from the 2026 LTV:CAC benchmark; the 3.2x cross-check from Optifai’s 939-company study.
Measure durable growth
ScaleXP combines customer revenue, gross margin, retention and acquisition cost to calculate LTV:CAC automatically—and shows how the ratio differs across customer groups.
Compare customer economics using consistent LTV and CAC definitions, supported by real finance and CRM data.
Automate Your SaaS MetricsExample unit-economics view
Customer lifetime value
$1,875
Based on customer revenue, gross margin and churn—not simply the total amount invoiced.
Illustrative example figures, not your live data.
To calculate the LTV:CAC ratio you need two inputs, and both need defining before the arithmetic matters.
Customer lifetime value (LTV) is usually average revenue per account multiplied by gross margin, divided by the churn rate. Using gross margin rather than revenue is what makes the figure comparable across business models: a company delivering at 80% margin genuinely earns more per customer than one at 40%, even on identical revenue.
Customer acquisition cost (CAC) is total sales and marketing spend divided by new customers won in the same period. The CAC calculation should include salaries and commission, not only advertising.
Worked through: a SaaS business with $500 average annual revenue per account, 75% gross margin and a 20% annual churn rate has an LTV of ($500 × 0.75) / 0.20 = $1,875. If CAC is $600, the LTV:CAC ratio is 3.1:1.
The churn rate sits in the denominator of lifetime value, which makes it the most powerful single input. Improving the retention rate from 80% to 90% halves the churn rate and doubles LTV, without changing customer acquisition cost at all.
That is why customer acquisition strategies aimed purely at volume tend to disappoint over the long term. Winning more customers who then leave quickly pushes CAC up and LTV down at the same time. Improving onboarding, support and product fit moves the ratio in both directions at once.
A good ratio is not universal. Self-serve products at low price points can sustain a lower ratio because payback is fast and the CAC calculation is dominated by marketing rather than sales headcount. Enterprise business models carry long sales cycles and high customer acquisition cost (CAC), so they need a higher ratio and a longer view to justify the spend.
Judge the ratio against your own trend and your gross margin profile, rather than against a headline figure from a very different kind of company.
This chart is an example of the monthly LTV:CAC ratio over time compared to budget, making it much easier to understand trends, improvements, even seasonality.
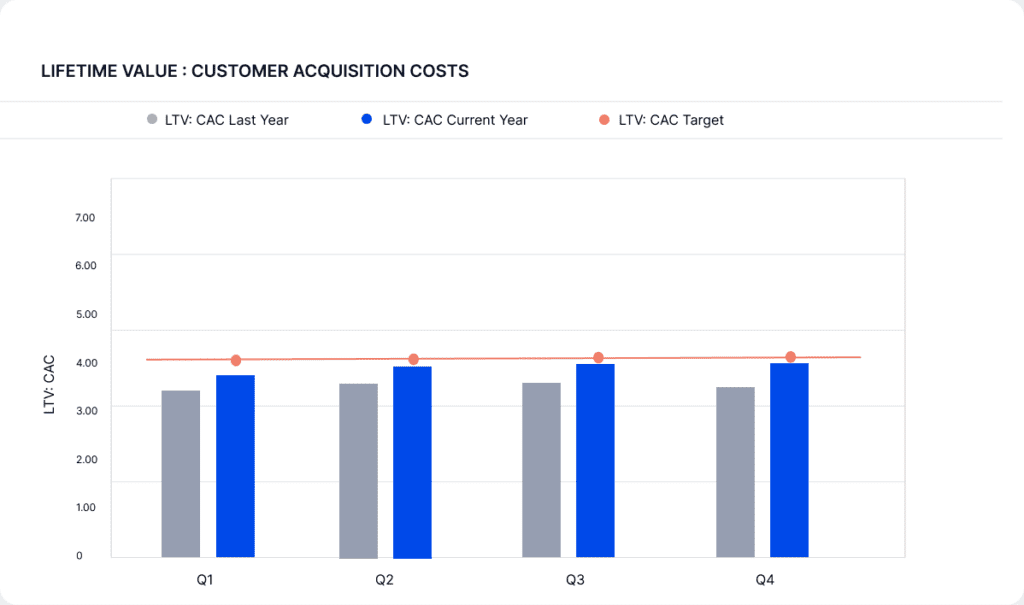
ScaleXP fully automates LTV / CAC ratios with easy customization of definitions as well as instant links to your finance systems, allowing instant visualization of all your data and KPIs as well as automated revenue recognition and analysis. See how ScaleXP automates revenue recognition.
See how the ratio fits alongside the rest of your reporting in ScaleXP’s SaaS metrics software.
Investors expect a B2B SaaS company to show an LTV:CAC ratio around the 2026 median of 4.1x, with top-quartile companies reaching 7.8x and the bottom quartile at 1.1x. Vertical SaaS companies achieve 5.6x, even though they take longer to recover acquisition costs. Because lifetime value depends heavily on retention, investors also check that the ratio rests on real churn data rather than optimistic assumptions. ScaleXP calculates LTV and CAC automatically from accounting and CRM data, giving investors an LTV:CAC ratio built on actual results.
Yes, ScaleXP calculates the LTV to CAC ratio automatically by combining revenue, gross margin and acquisition spend from Xero, QuickBooks or Zoho Books with customer data from HubSpot, Salesforce or Pipedrive. Lifetime value uses actual retention and margin, while CAC uses the sales and marketing accounts finance already closes. ScaleXP prepares both metrics daily alongside CAC payback and 30+ other SaaS metrics. Finance teams get unit economics they can rely on without maintaining a separate LTV:CAC spreadsheet.
ScaleXP keeps the LTV:CAC ratio consistent with the financial statements because both sides of the ratio come from the ledger. Gross margin and sales and marketing spend are read from Xero, QuickBooks or Zoho Books, the same source as the P&L, and customer counts come from matched records in HubSpot, Salesforce or Pipedrive. Finance defines which costs count as acquisition spend and which belong in cost of sales, and ScaleXP applies those rules every period. Investors get an LTV:CAC ratio that reconciles to the management accounts.
Yes, ScaleXP compares LTV:CAC by customer segment and cohort in live dashboards and PowerPoint board packs, so directors see which customers deliver the strongest return on acquisition spend. Finance teams can set SMB, mid-market and enterprise side by side and drill down in presentation mode to the customers behind each ratio. Matan, Director of Finance, says: “The prebuilt KPIs are really valuable and save me a lot of time.” Leadership can direct sales and marketing budget toward the customers worth acquiring and keeping.
For Xero, QuickBooks and Zoho Books
ScaleXP shows which customers create durable value by connecting acquisition cost with revenue, margin and retention. Compare LTV:CAC by segment or cohort and put more investment behind the growth that genuinely pays.
From customer data to durable unit economics
Bring together acquisition spend, customer revenue and retention data from the systems you already use.

The total revenue a customer is expected to generate before they leave.

Measures how long it takes for a company to recoup the costs of acquiring a new customer.
““producing more insights, faster and with greater accuracy”
SaaS metrics
ScaleXP calculates LTV, CAC and 30+ other SaaS metrics straight from your accounting and CRM data, prepared daily.
In a 30-minute demo, we’ll show the relevant workflows using example data and discuss how they could apply to your finance process. Complex requirements? Discuss them with us first.