See how ScaleXP works with Xero or QuickBooks.
In a 15- or 30-minute demo, we’ll show the relevant workflows using example data and discuss how they could apply to your finance process. Complex requirements? Discuss them with us first.
Understand your MRR growth rate, calculate it with your own numbers, see what the published annual growth benchmarks show, and get practical tips to improve it.

MRR GROWTH RATE
No benchmark is published for the monthly rate.
Publishers survey annual growth, not monthly. A monthly benchmark is the twelfth root of an annual figure, which is arithmetic rather than a second measurement.
2026 benchmark · 1,000+ private B2B SaaS companies
This article will provide
MRR Growth Rate is the percentage by which a company’s monthly recurring revenue (MRR) has increased or decreased over a certain period of time, most typically a quarter or a year.
MRR Growth Rate is calculated by dividing the revenue for the current period by the revenue from the prior period and then subtracting 1.
Both figures are monthly recurring revenue; see the MRR formula for how to calculate them.

For example, if a company had revenue of $100,000 in 2020 and $120,000 in 2021, its MRR Growth Rate would be calculated as follows:(120,000 / 100,000) – 1 = 0.2 = 20% Annual MRR Growth
In this example, annual figures are used. When revenue is calculated using just one month, the result is taken to the power of 12 to the get annualized result.

Change in MRR: $20,000

MRR Growth Rates vary widely by industry and company size, so the best indication of performance is frequently an internal comparison to prior quarter or prior year.
This being said, MRR Growth Rates are widely benchmarked.
The best MRR Growth Rates consider both the size of the SaaS business and their target customers.Ourarticle on 2022 MRR benchmarkshas full details.
This table provides a quick overview by company size, measured as annual revenue:
Growth benchmarks are published as annual revenue growth, and the current median is the lowest in five years. The more useful question for 2026 is no longer how fast the median company grows, but what that growth costs to produce.
Median Rule of 40 score.
| Annual growth | Median Rule of 40 |
|---|---|
| Over 50% | 57 |
| 31–50% | 8 |
| Under 10% | 19 |
The shape here is the interesting part, and it is not a straight line. Companies growing 31–50% score worse than companies growing under 10%. That band is the expensive middle: fast enough to carry the cost base of a high-growth company, not fast enough for the growth to pay for it.
| Cost line | Prior year | Latest |
|---|---|---|
| R&D | 35% of revenue | 27% |
| Sales & marketing | 37% of revenue | 35% |
Source: 2026 Aleph × Benchmarkit SaaS & AI Performance Benchmarks, published 1 June 2026, reporting full-year 2025 actuals from 342 B2B SaaS and AI-native companies. Rule of 40 was reported by 110 of them, so the growth-cohort bands sit on small samples. Growth medians are from SaaS Capital’s 2026 private B2B SaaS growth benchmarks, covering more than 1,000 private companies, with the 342-company Aleph × Benchmarkit sample used as a cross-check.
Explain the movement
ScaleXP calculates MRR growth from live customer and finance data, then separates the movement into new business, expansion, contraction and churn.
Turn one growth percentage into a clear explanation of where recurring revenue was won, expanded or lost.
Automate Your SaaS MetricsExample MRR growth view
Starting MRR
$100,000
The recurring revenue base at the beginning of the measurement period.
Illustrative example figures, not your live data.
| Annual revenue | 2020 | 2021 | 2022 |
|---|---|---|---|
| Less than $1M | 100% (12-177%) |
100% (26-300%) |
100% (46-286%) |
| $1M - $2.5M | 60% (31-100%) |
90% (45-300%) |
79% (37-153%) |
| $2.5 - $10M | 41% (22-84%) |
50% (30-100%) |
50% (30-115%) |
| $10M - $20M | 46% (25-71%) |
50% (20-75%) |
72% (30-101%) |
| $20M- $50M | 50% (18-75%) |
35% (25-49%) |
40% (30-52%) |
| More than $50M | 21% (14-40%) |
30% (10-56%) |
30% (18-55%) |
For historical context, the table above reports an earlier benchmarking study with data for 2020, 2021 and 2022. Identify the row matching your annual revenue: the bold figure is the average growth rate for companies of that size, with the lowest and highest quartiles either side. The 2026 benchmarks above are the current comparison.
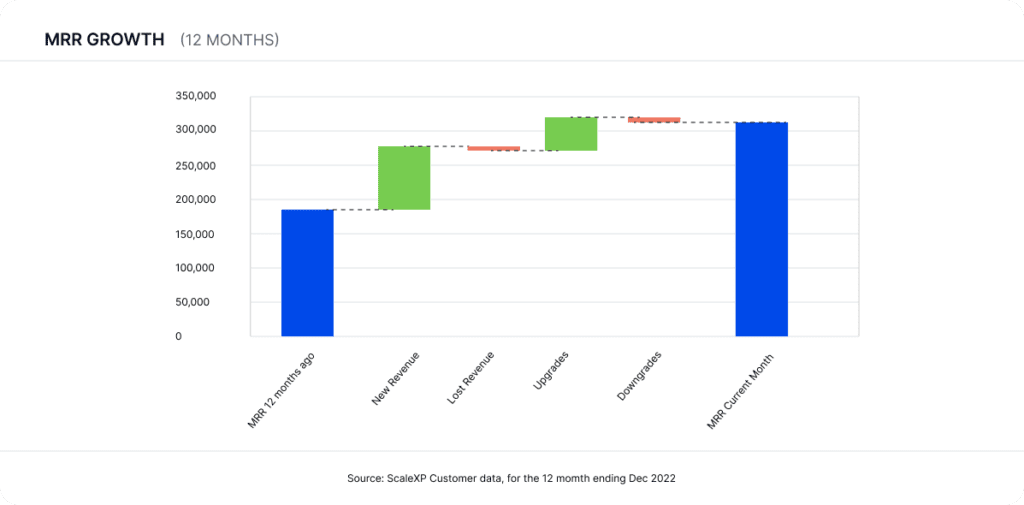
ScaleXP fully automates MRR and MRR growth rate calculations. Using a series of smart test recognition algorithms, revenue is split into New, Lost, Upsells, and Downgrades.
Charts are built to show performance over time, by month, quarter, or year. This data makes it easier for SaaS companies to track performance and focus on driving performance, rather than data compilation.
Comparing MRR and subscription analytics tools? See our ChartMogul alternatives comparison.
An MRR growth rate of about 1.67% a month matches the 2026 median of 22% annual revenue growth for B2B SaaS, because monthly growth compounds over 12 months. Dividing the annual rate by 12 would set the monthly target too high. Growth has declined for four consecutive years, yet the median Rule of 40 rose from 15 to 25 thanks to margin discipline. ScaleXP calculates MRR growth rate automatically from accounting and CRM data, so finance teams can track monthly progress against an annual target with numbers that tie to the ledger.
Yes, ScaleXP calculates monthly recurring revenue growth automatically from invoices in Xero or QuickBooks Online and customer data in HubSpot, Salesforce or Pipedrive. ScaleXP separates every movement into new business, expansion, contraction and churn, so finance can see what drove MRR growth each month. The metric is prepared daily alongside 30+ other SaaS metrics. Finance teams stop rebuilding growth calculations in spreadsheets and get an MRR growth rate that is consistent month after month.
ScaleXP explains changes in MRR growth rate by breaking each period into new, expansion, contraction and churn MRR in live dashboards and PowerPoint board packs. Directors see whether growth came from winning customers or from expanding existing ones, and whether churn is holding it back. In presentation mode, the board can drill down to the customers behind every movement. Finance teams explain MRR growth before the board asks, with figures built from invoices in Xero, QuickBooks or Zoho Books.
ScaleXP keeps MRR growth rate consistent with reported revenue because MRR is built from the invoices and journals in Xero or QuickBooks, and one-off fees are excluded so they do not inflate growth. Revenue recognition schedules under IFRS 15 and ASC 606 sit alongside, so the link between recurring revenue and recognized revenue stays clear. Finance defines upgrades, downgrades and reactivations once, and ScaleXP applies the same rules every month. Boards and investors get growth figures that reconcile to the management accounts.
Definitions, formulas, and this year’s median and top-quartile numbers for all 20 metrics in the library. One PDF you can take straight into your next board meeting.
See our privacy policy.
Your report is ready.
Download the 2026 SaaS Benchmark Report We’ve emailed you a copy as well.For Xero, QuickBooks and Zoho Books
ScaleXP shows more than the headline growth rate. See how much came from new customers, expansion, contraction and churn—and trace every movement back to the customers and transactions behind it.
From revenue movement to a clear growth story
ScaleXP brings together contracts, invoices and customer data from your connected systems.

MRR – MONTHLY RECURRING REVENUE
A forward looking view of MRR, usually MRR plus new bookings less churn.

REVENUE GROWTH RATE
Percentage increase in revenue over a certain period of time, most typically a quarter or a year.

ARR – ANNUAL RECURRING REVENUE
Predictable revenue that a company can expect to receive on an annual basis.
““producing more insights, faster and with greater accuracy”
SaaS metrics
ScaleXP calculates MRR growth and 30+ other SaaS metrics straight from your accounting and CRM data.
In a 15- or 30-minute demo, we’ll show the relevant workflows using example data and discuss how they could apply to your finance process. Complex requirements? Discuss them with us first.