See how ScaleXP works with Xero, QuickBooks or Zoho Books.
In a 30-minute demo, we’ll show the relevant workflows using example data and discuss how they could apply to your finance process. Complex requirements? Discuss them with us first.
Understand cash burn and runway, calculate them with your own numbers, and get practical tips to extend the runway you have.

CASH BURN AND RUNWAY
No published benchmark exists for burn or runway.
Neither publisher surveyed reports a burn or runway distribution, and a median would say little: runway is a function of how much you last raised, not how well the business is run. Rather than substitute a proxy, no benchmark is shown.
This article will provide
Cash Generated, or Cash Burn for companies not yet making a profit, refers to the amount of cash the company is either generating or using (“burning”) after taking into account revenue and covering its operating expenses, investments, and other cash outflows over a specific time period.
Cash Runway is the amount of time, at current Cash Burn run rate, until a company runs out of cash.
Definitions, formulas, and this year’s median and top-quartile numbers for all 20 metrics in the library. One PDF you can take straight into your next board meeting.
See our privacy policy.
Your report is ready.
Download the 2026 SaaS Benchmark Report We’ve emailed you a copy as well.Cash Generated, or Cash Burn, is calculated as the difference between the company’s cash inflows (such as sales revenue) and its cash outflows (such as product costs, operating expenses, research and development costs, etc.) over that period. Financing flows such as loans and investment are excluded, but ongoing financing costs such as interest expense are included.
For companies that are not yet covering their expenses, the Cash Burn rate is expressed as a negative value, representing the net cash outflow during a given period.
The formula is:

As in the above example, the current monthly rate of Cash Generated or Cash Burn is often generated using average data over the past year, to smooth out any one month anomalies in run rate.
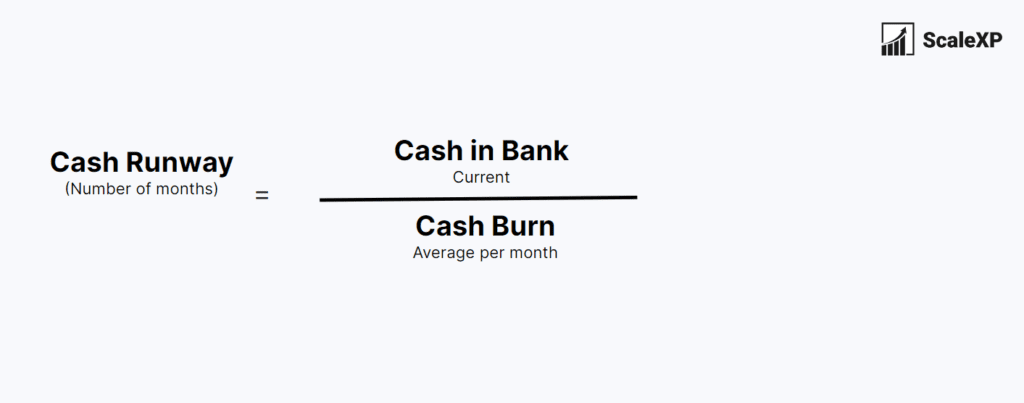
Cash Runway is generally expressed in number of months and is calculated as the amount of available cash divided by the current Cash Burn rate.
The formula is Cash in Bank, divided by Cash Burn, as shown below.

SaaS companies, particularly those which are growing rapidly, generally burn cash rather than generate it. This is because the cost of acquiring each new customer is not recovered immediately after the customer is acquired. SaaS companies often prioritize growth and market penetration over short-term profitability and cash generation. Monitoring cash burn helps the company make the necessary decisions to ensure long-term viability.
Measuring payback time for acquiring new customers, or CAC Payback, is a key component of understanding Cash Burn rates. Read more about CAC Payback here.
For the full study behind these figures, see our SaaS cash burn benchmarks report.
Burn is best benchmarked two ways: how efficiently it converts into new revenue, and how many months of it you are expected to be holding. Both moved in 2026, and they moved in the same direction.
Months of runway investors expect before Series A outreach.
| Burn multiple | Share of companies | What it means |
|---|---|---|
| Below 0.33x | 24% | Under 33 cents of net burn per $1 of net new ARR. Exceptional capital efficiency. |
| 1.12x | the median | The typical cash-burning company spends slightly more than it adds in new ARR. |
| Above 1.0x | 51% | More than $1 burned for every $1 of net new ARR added. |
Just over half the sample sits above 1.0x. That is the line worth knowing: below it, growth is partly funding itself; above it, every additional dollar of ARR costs more than a dollar of cash to buy.
The 1.12x burn multiple is an observed median, drawn from 55 cash-burning private companies. It is a real measurement, but a small sample — treat it as directional rather than definitive, and expect it to move as coverage widens.
The 24–30 months is investor guidance, not an observed median. It is what Series A investors currently say they expect to see, not a measurement of what companies actually hold. No credible public 2026 dataset publishes runway quartiles by stage, so anyone quoting one should be asked where it came from.
Sources: runway expectations from CRV’s 2026 guidance on how Series A investors evaluate burn. Burn multiple distribution from The SaaS CFO’s 2026 analysis of 55 cash-burning private companies. Cost-base figures from the 2026 Aleph × Benchmarkit SaaS & AI Performance Benchmarks, 342 companies, full-year 2025 actuals.
See how long your cash lasts
ScaleXP combines your current bank balance, actual cash movements, working capital, budget and forecast to keep burn and runway visible without another spreadsheet.
Separate gross burn from net burn, exclude financing flows and calculate runway from the cash that is actually being depleted.
Automate Your SaaS MetricsExample connected cash-runway view
Cash in bank
$1.2 million
The cash currently available to fund operations and future investment.
Illustrative example figures, not your live data.
Two figures are both commonly called burn, and confusing them makes runway look better or worse than it is.
Gross burn rate is total company spending in a month: payroll, hosting, tooling, rent and every other operating cost. It ignores income entirely.
Net burn rate is gross burn minus monthly revenue. It is the figure that actually depletes cash reserves, and the one runway should be calculated from.
An early stage company with $180,000 of operating costs and $60,000 of monthly revenue has a gross burn rate of $180,000 and a net burn rate of $120,000. With $1.2m in the bank, quoting the gross figure implies under seven months of runway; the net figure gives ten.
Three terms are used almost interchangeably in board meetings, and they measure different things. Two are about cash, one is not about cash at all. Run rate and runway sound alike and often appear on the same slide, which is where most of the confusion starts.
Burn rate is money per month. Cash runway is time. Run rate is an annualized measure of revenue — how big the business is now, not how long it lasts.
| Term | Measured in | The question it answers | Calculation |
|---|---|---|---|
| Burn rate | Currency per month | How fast is cash leaving? | Cash out − cash in, per month |
| Cash runway | Months | How long until the cash runs out? | Cash balance ÷ net monthly burn |
| Run rate (ARR) | Currency per year | How big is the business right now? | Latest period revenue × periods in a year |
Use the net burn figure from the section above for runway. Dividing the cash balance by gross burn ignores the revenue still coming in and will understate how long the business has. For the revenue side of run rate, see annual recurring revenue and monthly recurring revenue.
Burn on its own is neither good nor bad. A company spending heavily to capture a market can be in better financial health than one spending little and growing slowly. What matters is the relationship between burn, growth and the cash reserves behind it.
The practical test is whether current company spending buys enough growth to secure additional funding on better terms before the runway runs out. If it does not, the spend is buying time rather than progress.
Reducing burn indiscriminately usually costs more than it saves. The sequence that tends to work:
At ScaleXP, the leading SaaS metrics tool, we have automated cash runway and related cash burn metrics using a range of inputs, including your current bank balance, recent burn rate, working capital, budget, and forecast, allowing you to monitor the data in a single click each month.
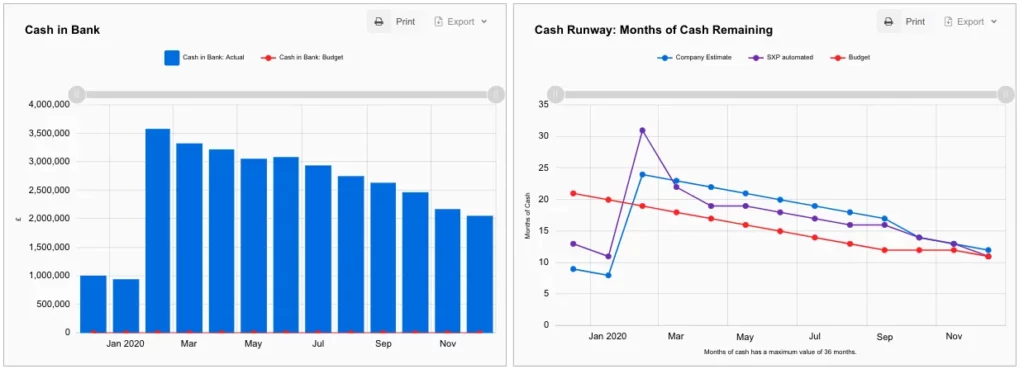
In 2026, SaaS investors expect 24–30 months of cash runway before a Series A raise, roughly double the 12–18 months expected in the prior cycle. Investors also look at the burn multiple, where the median is 1.12x and 0.33x signals exceptional capital efficiency. A company that cannot show its cash runway and cash burn with confidence starts any raise on the back foot. ScaleXP calculates cash burn and runway automatically from Xero, QuickBooks or Zoho Books, so founders and finance teams know how many months of cash they have and can plan the raise around it.
Yes, ScaleXP calculates cash burn rate and cash runway automatically from the accounting data in Xero, QuickBooks or Zoho Books. ScaleXP separates gross burn from net burn and excludes financing flows such as new equity and debt, so runway is based on the true operating cash position. The figures are prepared daily and tracked month by month, which turns burn from a one-off spreadsheet exercise into a live trend. Finance teams get a runway number they can defend to the board without rebuilding the model every month.
ScaleXP keeps cash burn consistent with the financial statements because every figure comes from the ledger in Xero, QuickBooks or Zoho Books, the same source as the P&L, balance sheet and cash flow. No separate cash tracker sits outside the books to drift out of line. Finance teams can compare actual burn against budget and forecast uploads, so variances show up early rather than at quarter-end. Because ScaleXP sits on top of the accounting system, there is no ERP migration and no replacement ledger, only reliable cash burn and runway figures.
ScaleXP puts cash runway, net burn and the burn trend into PowerPoint board packs and live dashboards, alongside budget vs actuals and forecasts. Directors see how many months of cash remain and what is driving burn, and in presentation mode they can drill down to the underlying accounts. ScaleXP also places burn next to growth metrics such as ARR and the Rule of 40, so the board sees spending in the context of results. The outcome is a cash runway story investors trust, prepared without late nights.
For Xero, QuickBooks and Zoho Books
ScaleXP tracks cash, net burn and runway from connected accounting data and shows how the outlook moves when revenue, costs or forecasts change. Finance and leadership work from the same current view.
From bank balance to a live runway
ScaleXP brings together cash balances, revenue, operating costs and working-capital movements.

Measures how long it takes for a company to recoup the costs of acquiring a new customer.

Percentage increase in revenue over a certain period of time, most typically a quarter, or a year.

A measure of growth or sales efficiency. Calculated as Revenue Growth divided by Customer Acquisition Costs.
““producing more insights, faster and with greater accuracy”
SaaS metrics
ScaleXP calculates burn, runway and 30+ other SaaS metrics straight from your accounting and CRM data, prepared daily.
In a 30-minute demo, we’ll show the relevant workflows using example data and discuss how they could apply to your finance process. Complex requirements? Discuss them with us first.