
1. Blog
  2. SaaS

2025 SaaS Benchmarks: CAC Payback Period

CAC payback period benchmarks for SaaS by ARR band, industry and customer size, with the formula and practical ways to shorten your payback.

Customer Acquisition Cost (CAC) and CAC Payback Period are two critical metrics for growth companies. They determine how efficiently a business can scale and how much capital is required to sustain that growth. Optimizing these metrics can improve cash flow, increase profitability, and attract investors.

In this article, we provide benchmarks so you can understand performance expectations.

This article provides a time-specific snapshot of CAC and CAC payback benchmarks published for 2025. For the current definition, formula, worked examples and latest benchmark data, see our CAC Payback Period guide. The earlier 2023 CAC and CAC payback benchmarks remain available for comparison.

What is Customer Acquisition Cost (CAC)?

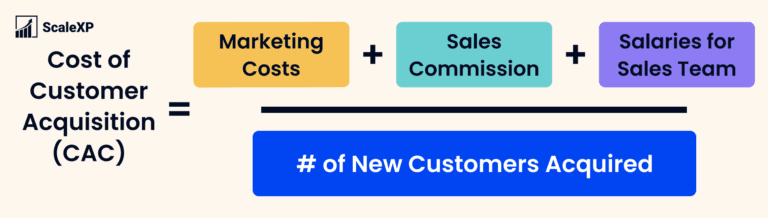
Customer Acquisition Cost, abbreviated CAC or CCA (for Cost of Customer Acquisition), measures the average cost of acquiring a new customer. It includes expenses such as:

  • Marketing and advertising
  • Business development
  • Salaries for sales and marketing teams
  • Sales commissions and incentive programs
  • Any other costs directly related to customer acquisition
As an example, ifyour total acquisition costs for a period are$20,000, and you acquire20 new customers, yourCAC is $1,000 per customer.
Formula for calculating the Cost of Customer Acquisition (CAC) displayed on a graphic.

CAC Formula by ScaleXP

What is CAC Payback Period?

The CAC Payback Period refers to the time (in months) it takes for a company to recover its CAC through the revenue generated by that customer.A shorter CAC Payback Period means your business recoups its investment faster, reducing cash burn and improving financial sustainability.

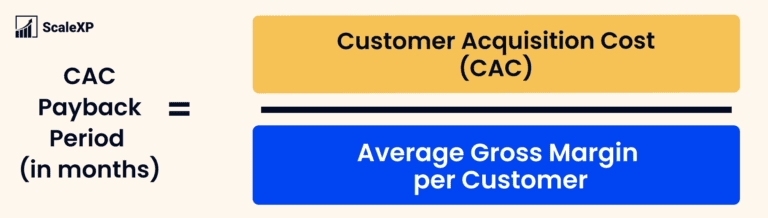
To calculate CAC Payback, simply divide CAC per month by the average Gross Margin per customer per month, as shown below. The result will be the number of months required to recoup acquisition costs.

As an example, if CAC or acquisition costs is $1,000, the MRR per customer is $150, and the gross margin is 70%, the CAC payback period would be approximately 9.5 months:
= 1000 / (150 * .7) = 9.5 months

Formula for calculating Customer Acquisition Cost and Payback Period displayed in a clear format.

CAC Payback Formula by ScaleXP – https://scalexp.com

Why is CAC Payback important?

Investors, CEOs, and CFOs closely monitor CAC Payback because it directly impacts business valuation (see SaaS multiples) and financial strategy.

The Venture Capital firm – OpenView Advisors – lists it in the top three most important metrics for SaaS companies, alongside Gross Dollar Retention and Net Dollar Retention. And at ScaleXP, we have certainly seen interest in this metric surge over the last 18 months.

What are the latest CAC Payback benchmarks?

In assessing your business’ performance vs benchmarks, it is important to consider two factors:

  • The size of your company measured by your ARR or annual revenue, and
  • Your target customers. Are you selling to large corporates or SMEs?

The graph below shows CAC Payback Period in months for SaaS companies. The horizontal axis indicates company size, starting with companies that have less than $1M ARR and ending with those of $50M ARR.

The green line indicates top quartile performance while the light blue is bottom quartile. It is worth noting that payback periods are shortest for the smallest companies, indicating that these companies are most efficient.

Line graph showing CAC payback periods for different revenue ranges, with quartiles indicated.

Source: OpenView 2023 SaaS Benchmarks Report

What is the impact of your target customer size?

Both the sector and the size of your target customers will impact your CAC Payback.

  • Industries with higher average revenue per customer, such as enterprise fintech tend to have longer payback periods (18–24 months). This reflects their longer and more complex sales cycles.
  • Sectors with shorter sales cycles and acquisition costs, such as edtech, achieve faster payback periods, making them more cash-efficient in the short term.
  • The table below shows both average and good performance by size of your customers as well as your SaaS sector.
Table displaying CAC payback benchmarks for various SaaS industries and customer sizes.

How can you optimize your CAC Payback?

Here are some key ways to have a material impact on your CAC Payback:

  • Monitor your CAC Payback monthly. Tracking performance is critical to improvement.
  • Improve your Gross Margin. Companies with the best CAC Payback period have higher Gross Margins. Review your Cost of Sales or Direct Costs to determine if you can trim costs. Hosting costs, which is typically the largest component of Cost of Sales, can be drive lower by looking for start-up or scaleup offers. AWS has generous incentives for start-ups and Google has launched some offers as well.
  • Improving Sales Conversions.Train sales teams, refine messaging, and shorten sales cycles.
  • Hone your marketing spend. Focus on efficient growth, rather than growth at any costs. Optimize paid campaigns and focus on high-converting channels.

Conclusion

SaaS companies must balance growth with efficiency. By tracking and optimizing CAC and CAC Payback, businesses can build sustainable revenue models, attract investors, and maintain strong financial health.

ScaleXP calculates SaaS metrics such as CAC payback, ARR and the Rule of 40 automatically by connecting Xero, QuickBooks or Zoho Books with HubSpot, Salesforce or Pipedrive, so finance teams track every benchmark from one source of truth that reconciles to the financial statements.

Frequently asked questions

What is a good CAC payback period for a SaaS company?

A good CAC payback period is one that compares well with companies of a similar ARR and a similar target customer, because both shape the benchmark. The OpenView 2023 SaaS Benchmarks Report shows payback periods are shortest for smaller companies, while enterprise-focused businesses carry longer paybacks. ScaleXP calculates CAC payback automatically from Xero or QuickBooks and the CRM, so finance teams track their own figure monthly against the right peer group. Leaders spot efficiency gains early and show investors disciplined, cash-efficient growth.

Can ScaleXP calculate CAC payback automatically from Xero and HubSpot?

Yes, ScaleXP calculates CAC payback automatically by combining sales and marketing costs from Xero or QuickBooks Online with new customer data from HubSpot, Salesforce or Pipedrive. ScaleXP works out customer acquisition cost, new MRR and gross margin, then calculates how many months it takes to earn back the investment in each new customer. The metric updates as data syncs, with no formulas to maintain. Finance teams get a reliable CAC payback figure every month and spend their time improving it rather than calculating it.

How does ScaleXP keep customer acquisition cost consistent with the P&L?

ScaleXP keeps customer acquisition cost consistent with the P&L by taking sales and marketing spend, including salaries, directly from the accounting ledger in Xero or QuickBooks Online. ScaleXP then divides that spend by new customers from the CRM, so CAC reconciles to the same costs the board sees in the management accounts. There is no separate marketing spreadsheet drifting away from the financial statements. The result is a CAC and CAC payback figure that investors trust and that finance can defend line by line.

How do SaaS finance teams use ScaleXP to shorten CAC payback?

SaaS finance teams use ScaleXP to shorten CAC payback by monitoring it monthly and seeing exactly which levers move it. ScaleXP tracks customer acquisition cost, gross margin and new MRR together, and breaks them down by segment, product line or tracking category from Xero or QuickBooks. Teams quickly see where hosting costs squeeze gross margin or where sales spend is not converting. Matan, Director of Finance, notes: “The prebuilt KPIs are really valuable and save me a lot of time.” Leaders act sooner and grow more efficiently.

Quick question

What’s most frustrating about reporting your SaaS metrics?

Choose as many as apply.

Please don’t include personal information. We read every answer.

Considering automating your SaaS metrics?
See it in a 30-minute demo.

How ScaleXP does this

ScaleXP calculates MRR, ARR, churn, retention and more from your CRM and accounting data, with no spreadsheets. See ScaleXP’s SaaS metrics