

See how ScaleXP works with Xero or QuickBooks.
In a 30-minute demo, we’ll show the relevant workflows using example data and discuss how they could apply to your finance process. Complex requirements? Discuss them with us first.
Where ARR and revenue growth sit at Seed, Series A, B, C and D, and what investors expect at each stage. Multiples are in the 2026 valuation guide.
This article focuses on 2026 SaaS benchmarks relating to revenue and specifically ARR, answering the following questions:
What is ARR?
How are ARR and MRR used in company valuations?
What is an ARR valuation multiple and how is it calculated?
How does ARR impact your ability to secure financing?
What are ARR valuation trends in 2026?
As a Saas CFO or Founder, how can you respond?
ARR stands for “Annual Recurring Revenue”. It represents the amount of recurring revenue a company expects to receive on an annual basis from its subscription-based products or services. ARR is a key metric for businesses that operate on subscription models such as Software as a Service (Saas) companies. It is often used by investors and analysts to assess the value of a company.
ARR (Annual Recurring Revenue) is calculated by multiplying the Monthly Recurring Revenue (MRR) by 12.
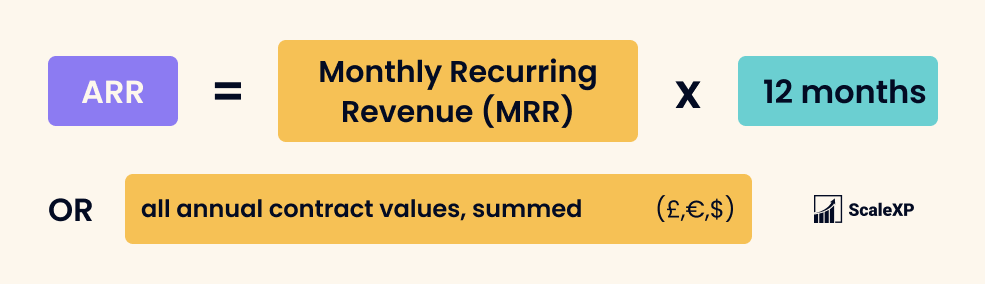
MRR, or Monthly Recurring Revenue, represents the predictable and recurring revenue generated from subscriptions on a monthly basis. MRR includes all regular, ongoing subscription payments made by customers, excluding any one-time or non-recurring charges.
Current ARR is often estimated by taking the most recent one month of revenue for all subscription customers and multiplying by twelve. So for example, if a company has a total of $10,000 per month in recurring revenue from current customers, then that company’s ARR is 12x $10,000 = $120,000.
Many investors and analysts look at ARR valuation multiples, also known as sales multiples or revenue multiples, as a key factor in determining company valuation.
For the full picture across public and private companies, including how the Rule of 40, NRR and GRR feed into pricing, see our detailed guide to SaaS valuation multiples.
ARR multiples are the company’s value divided by ARR. For example, if a company is valued at $100m and has ARR of $10m, then its ARR valuation multiple is 10. For public companies, company value is updated regularly by trading in the public markets: it is the company’s Enterprise Value, that is, the value of all publicly traded shares plus other investments such as debt financing. For private companies, values are based on the latest round valuation.
Historically, ARR and ARR growth rates have been critical to securing funding from investors for SaaS and other subscription businesses.
Seed Round: At the seed stage, investors are generally focused on the potential for ARR growth and market opportunity. Although there may be less emphasis on the current ARR, a higher ARR can demonstrate that the company has an established customer base and a product that resonates with users. Key factors that investors will look into at seed stage are: sales traction, team expertise, prototype or MVP quality, market opportunity, and total available (or addressable) market (TAM).
Series A Round: As a SaaS company grows and becomes more established, investors will expect to see a significant increase in ARR every year, or high ARR growth rates. This is a key indicator that a company is ready to scale. In this phase, the key valuation metrics include: annual recurring revenue (ARR), ARR growth rate, net retention revenue, customer acquisition cost (CAC), and customer lifetime value (LTV).
Series B and Later Rounds: By the time a company reaches a Series B or later round, investors will be looking for a proven track record of sustained ARR growth and a clear path to profitability. Key valuation metrics include: ARR, ARR growth rate, net retention revenue, gross margin, CAC payback period, and market sentiment or valuation multiples.
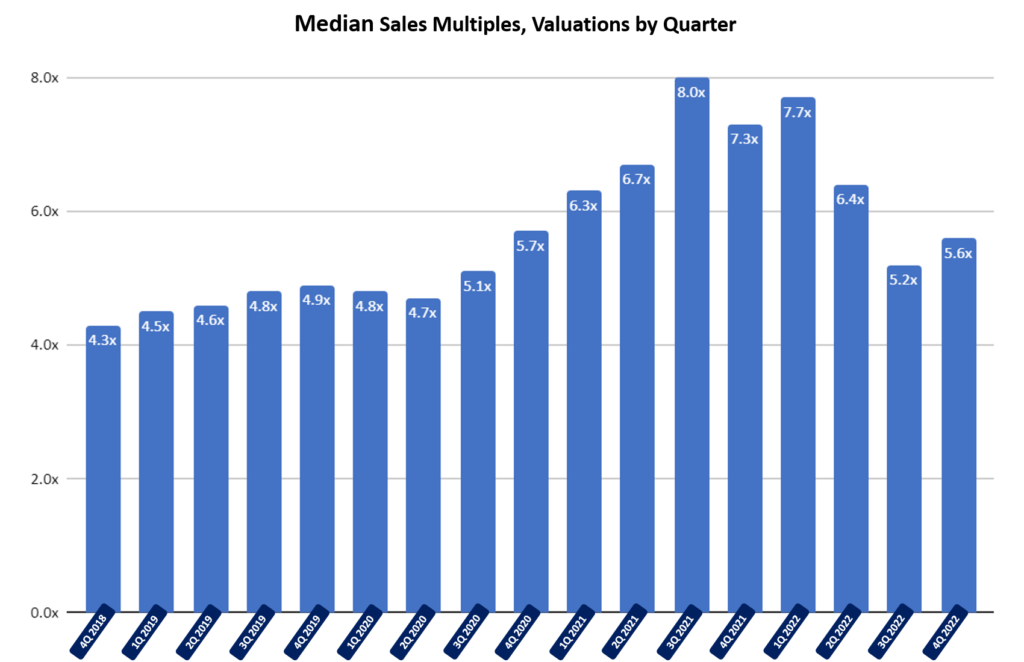
Heading into 2026, public SaaS companies are trading well below their pandemic-era peaks. Meritech’s April 2026 Software Pulse put the median implied ARR multiple for public software companies at 3.2x, while the top 10 performers commanded a median of 11.7x, a reminder of how wide the gap has grown between average and best-in-class SaaS businesses. (Source: Meritech Software Pulse, April 2026).
The BVP Nasdaq Emerging Cloud Index shows an average revenue multiple of around 6.2x alongside average revenue growth of 19.4%. Valuations remain well below the highs of 2021, when public multiples peaked near 14.7x, but they have stabilized at a more disciplined level than the trough seen in 2022 to 2023. (Source: BVP Nasdaq Emerging Cloud Index, 2026).
On the private side, the Finerva/SEG B2B SaaS benchmark put revenue multiples at 5.9x in 2025, down from 6.7x in 2024, while Aventis Advisors’ Rule of 40 analysis found a median EV/revenue multiple of 3.6x among listed SaaS companies, with only 15% of the 55 companies reviewed clearing the Rule of 40 threshold on an EBITDA basis. (Source: Aventis Advisors; Finerva/SEG B2B SaaS Benchmark, 2026).
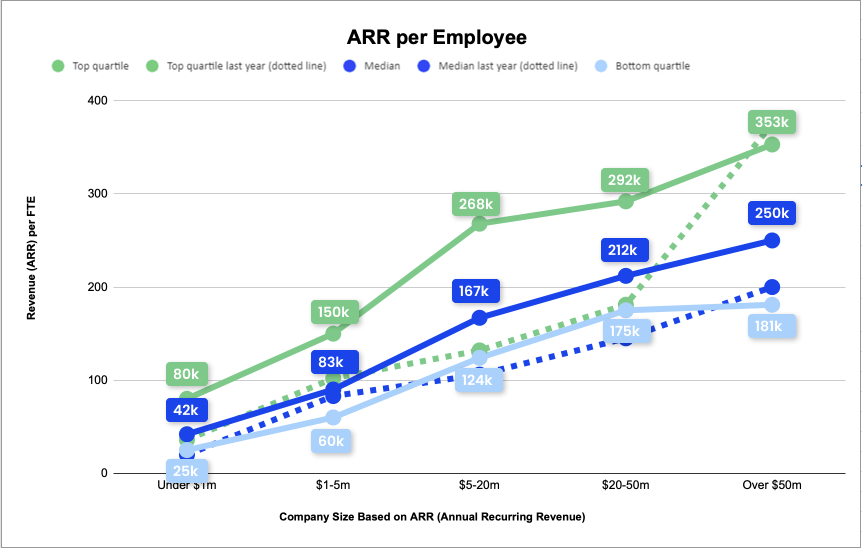
Another interesting valuation trend is the increasing importance of ARR per FTE. While investors recognize that this will be quite low in early stage companies, they are looking for a scalable model in which ARR per FTE is at least $200k – $250k by the time a company has reached scale. The below chart illustrates how successful SaaS companies have been able to growth their ARR per FTE with scale. (Source:OpenView 2023 SaaS Benchmarks Report)
Our top advice is:
Understand and monitor your cash burn rate so that you can fundraise confidently and at the appropriate time.
Focus on efficiency and profitability, not just sales. Our SaaS R&D spend benchmarks show how engineering budgets compare by ARR band.
Shift your focus from “Grow at any cost” to “Smart growth”. One simple way to do this is to monitor CAC Payback and focus on reducing it. Read more on CAC benchmarks here.
Watch metrics such as Rule of 40, as it is a key driver of valuations in the current market.
As you work to make your cash work harder, ScaleXP helps. It sits on top of Xero, QuickBooks or Zoho Books and your CRM, and calculates 30+ SaaS metrics automatically, from MRR and cash burn to the Rule of 40 and CAC payback, all reconciled to your financial statements.
SaaS founders should use 2026 ARR valuation benchmarks as a reference point, then prove their own revenue quality with accurate metrics. The BVP Nasdaq Emerging Cloud Index shows an average revenue multiple of 6.2x alongside average revenue growth of 19.4% in 2026, so growth and multiple move together. ScaleXP calculates ARR, ARR growth and net revenue retention automatically from Xero, QuickBooks or Zoho Books, so founders benchmark against reconciled numbers. Investors see a credible growth story backed by data rather than a spreadsheet estimate.
Yes, ScaleXP calculates annual recurring revenue automatically from Xero, QuickBooks Online or Zoho Books, combined with deal data from HubSpot, Salesforce or Pipedrive. ScaleXP reads every recurring invoice, normalizes it to monthly and annual values and produces MRR and ARR by customer, product and segment. Because ARR is built from accounting records, it reconciles to the financial statements and stands up to investor scrutiny. Finance teams stop recalculating ARR in spreadsheets each month and always have an up-to-date figure ready for the board.
ScaleXP shows the ARR movements investors check through an automated ARR waterfall that splits growth into new, expansion, contraction, churn and reactivation. ScaleXP builds the waterfall from Xero or QuickBooks invoices, so every movement drills down to the customer behind it. Cohort analysis, net revenue retention and gross revenue retention sit alongside it, giving investors the quality-of-revenue view that drives an ARR valuation. Founders answer diligence questions instantly and present growth that is clearly explained and fully reconciled.
ScaleXP gives SaaS CFOs preparing an ARR-based funding round a complete, investor-ready metrics pack drawn straight from the accounting and CRM data. ScaleXP calculates more than 30 SaaS metrics, including ARR, NRR, CAC payback and LTV, and turns them into live dashboards and PowerPoint board packs with drill-down to the source. Estiaan, Finance Manager at Cue Technology, says: “It’s allowed me to provide our directors and potential investors with real-time information on our SaaS metrics.” CFOs enter the raise with trusted numbers.
Quick question
Choose as many as apply.
Please don’t include personal information. We read every answer.
Considering automating your SaaS metrics?
See it in a 30-minute demo.
How ScaleXP does this
ScaleXP calculates MRR, ARR, churn, retention and more from your CRM and accounting data, with no spreadsheets. See ScaleXP’s SaaS metrics →
““producing more insights, faster and with greater accuracy”
SaaS metrics
ScaleXP calculates 30+ SaaS metrics straight from your accounting and CRM data, prepared daily.
In a 30-minute demo, we’ll show the relevant workflows using example data and discuss how they could apply to your finance process. Complex requirements? Discuss them with us first.